Author Archives: Phil Agee

Ambiguity and autonomy

In summarizing my experience morphing together a grant proposal and a final class paper for our course, I would say that the process presented an interesting ambiguity perhaps best framed by the following question: In terms of the readership of this kind of hybrid paper, how different is an interlocutor represented by seminar participants from the judges of grant competitions in grant making organizations? I would have to admit that, while it might depend on particular grant making personnel, writing with either a generic foundation or the federal government in mind shifted my sense of critical analysis and academic freedom. With a seminar paper written largely in conversation with course readings, instruction, and class discourse, there seems to be plenty of space for imaginative and perhaps even heterodox inquiry. Grant seeking proposals arguably require conformance with the norms, models, and ideologies of the administration of the grant making organization. Does autonomy of academic work matter and if so how much autonomy can be sacrificed without undermining principles?

Certainly academic research in such areas as nuclear and military projects poses stark ethical dilemmas. To what extent are ethical questions relating to funding relevant for DH? This line of thinking quickly leads to difficult yet emancipatory critiques of the university and higher education, problems of neoliberalism, and the stunting realities of austerity politics. Yet the imaginary endures of the possibility of fully funded academic programs (instead of depending so much on the NEH) that are autonomous from government institutions and private philanthropies. If the critique of the neoliberal university is valid, is it not incumbent upon members of the university community to consider the extent to which projects challenge either directly or indirectly the hegemony of the neoliberal agenda? Perhaps in the end this line of thinking points to the personal evaluation of doing the right thing, at the right time, by the right people (and the sobering doubt that my efforts might ultimately be helping to guide change in the direction of the slow motion train wreck).

Given this ambiguity I was wondering what a paper would look like that combined critical analysis with a proposal for funding. As it turned out, it was yet another generative and curious experiment to mixin and mashup some of the language of critical analysis with the language of grant seeking. Perhaps therein lies the art and craft of interfacing with the larger funding enterprises. Looking back, though, I wonder how much of the language of critical studies is palatable to larger grant making institutions. While there are arguably a handful of small foundations comfortable with heterodox projects that question dominant ideologies, projects that might resemble such efforts as Torn Apart/Separadoes or wikileaks would seem to be out of scope for many if not most grant making organizations. Or perhaps this is the line that separates responsible academic work from investigative journalism.

In reflecting on the idea of a Zoom App Integration, it’s not entirely clear the extent to which such an app integration might unequivocally contribute to challenging the neoliberal agenda. Perhaps one possibility lies in the potential for creating a context for learning that in some way maintains affordances for speaking truth to power, questioning all assumptions, and insisting on the fundamental dignity of every human being and the biosphere. In the spirit of experiment and open ended inquiry (and other qualities embodied in our class), I am left with a sense of  work to be done and how to do justice to the transformative dialog, readings, and instruction I am grateful to have experienced in this class and community.

Home Page of Digital Paxton

Workshop Report: “Choosing Your Online Platform: A Crash Course in Scalar”

Early in October I attended a workshop presented by Dr. William D. Fenton, Director of Research and Public Programs at the Library Company of Philadelphia, on “Choosing Your Online Platform: A Crash Course in Scalar”.  Sponsored by the PublicsLab and the GC Digital Initiatives, the workshop was hosted by Dr. Stacy Hartman, Director of the PublicsLab. The workshop offered attendees a wealth of hard-earned lessons Dr. Fenton has accumulated over five years of designing, directing, and maintaining the Scalar-powered digital scholarship project Digital Paxton. As a digital collection, critical edition, and teaching platform built on Scalar, Digital Paxton is an immersive and aesthetically state-of-the-art experience of an 18th century pamphlet war about “a little-known massacre” in 1763 in which “a mob of settlers from Paxtang Township murdered 20 unarmed Susquehannock Indians in Lancaster County, Pennsylvania.” Beyond being a case study of Scalar and offering a comparison with other platforms, the workshop unraveled critical issues and questions about the value and role of digital projects and the digital humanities. Many of the topics we have discussed in our class surfaced through Dr. Fenton’s introduction to Scalar in the context of Digital Paxton.

Evaluating the Need for a Digital Project

Dr. Fenton began the workshop with an illuminating discussion of the elements of a high level needs assessment, which consisted of questions for scholars to consider before beginning a digital project:

  1. What is the relationship of your digital project to your scholarship?
    Dr. Fenton recommended that there be at least a “symbiotic” relationship between the digital project and your scholarship.
  2. What problem does your digital project address?
    In the case of Digital Paxton, creating an online digital website offered a number of benefits including: offering access to a set of artifacts whose last edition was published in 1957 and which suffers from issues such as a restrictive price; an ambiguous distinction between pamphlets, engravings, and political cartoons; many artifacts cited, clipped, or reprinted without context; only a subset of the approximately 71 pamphlets are available via the Internet while others are available only through expensive archival services; finding artifacts is limited by cumbersome search methods that offer little to no “sense of contingency, exchange, and interplay” or of “the gaps between the interpretations” surrounding the massacre, which make up some of the principle analytical goals of the scholarship.
  3. Who is (are) your audience(s)?
    Dr. Fenton suggested that should the audience be limited to a small group, such as a group of fellow scholars or a dissertation committee, platforms such as WordPress or Manifold may offer a better fit in terms of time and effort needed to complete the work and the affordances for online feedback and discussion. In the case of Digital Paxton the audience was envisioned to include more broadly all interested scholars, educators, their students, and members of the public.
  4. How will you measure success?
    Dr. Fenton envisioned the digital project as a way to: “surface materials that give voice to the ‘backcountry’ or borderlands”; “provide researchers access to scans and transcriptions”; “foreground the latest scholarship and pedagogy”; “tell multiple stores about and through the Paxton corpus”; “integrate new materials as identified or as they become available”.  As limitations or critical watch outs, Dr. Fenton identified the problem of a distorted understanding arising from the lack of records; the risk of reproducing colonial biases, assumptions, and erasures; the inability of artifacts to present alternative imaginaries; the need to offer a plurality of perspectives, some of which recenter narratives around the nation of the “Conestoga, their resilience, and their central role in the history of colonial Pennsylvania”.
  5. How much time are you willing to invest?
    Dr. Fenton offered the aphorism digital archivists commonly attribute to digital projects: “free as in puppies not as in beer”. Digital projects absorb any and all time made available. As a result, an estimate of time required to achieve a good enough result in relation to other commitments is essential to the success of the project.
  6. When is your project complete?
    To avoid impinging on other commitments, Dr. Fenton recommended that  consideration be given to how the project might at a certain point be handed off  to an institution or be designed to run with sufficient degree of automated maintenance.
  7. Does your institution support a particular platform?
    A key consideration in the selection of a platform is the extent to which there is infrastructure support from your institution for the platform. Dr. Fenton worked with and received institutional infrastructure support from Fordham University and The Library Company of Philadelphia and sponsorship from the Historical Society of Pennsylvania.

Comparing Platforms

Dr. Fenton offered a comparative analysis of Scalar with three other platforms: WordPress, Omeka, and Manifold. Each platform has different strengths that suit it for different goals of digital scholarship and community engagement.  All platforms are licensed under open source licenses with code repositories hosted on Github.

  1. WordPress, licensed under the GNU Public License, is a good choice in that it offers: free hosting via CUNY Commons; ease of use; great integration with plugins and themes; high customizability; and affordances for online communication. The codebase is built with PHP and Javascript and was first released in 2003.   Notable examples include: The PublicsLab, The CUNY Academic Commons, and Ghost River.
  2. Omeka, licensed under the GNU General Public License, is a good choice for curating images and collections and is popular with the GLAM community (galleries, libraries, archives, and museums). The platform is structured around objects and collections of objects with a considerable degree of customizability. The platform is sponsored by the Corporation for Digital Scholarship. The codebase is built with PHP and Javascript and was first released in 2008.  Notable examples include: The September 11 Digital Archive, Intemperance, and DIY History.
  3. Manifold, licensed under the Educational Community License version 2.0 (“ECL”) of the Apache 2.0 license, was established through the GC Digital Scholarship Lab.  It offers a state-of-the-art user experience based on rapid application development in Javascript and Ruby on Rails.  Manifold is a good choice for projects that benefit most from the transformation of a MS Word, Google Doc, or EPUB document into an online edition. Unlike Omeka and Scalar, Manifold is especially designed for online discourse and academic conversations through advanced annotation and commenting. Version v1.0.0-rc.1 of the codebase was released in March of 2018.  Notable examples include: Debates in the Digital Humanities, Metagaming, and Negro and the Nation.

Presenting Scalar

Dr. Fenton’s primary takeaway regarding Scalar is its effectiveness in the presentation of non-linear datasets and born-digital scholarship. The platform can be run as a paid hosted instance, a personally self-hosted instance, or an institutionally hosted instance. Artifacts are uploaded into a flat ontology and structured around objects and sequences of objects known as “paths”. Scalar’s data entities are modeled on the semantic web’s Resource Description Framework (RDF), which enables compatibility across  schemas. Scalar is a project of The Alliance for Networking Visual Culture with funding support from the Andrew W. Mellon Foundation.  Licensed under the Educational Community License version 2.0 (“ECL”) of the Apache 2.0 license,  the codebase  was beta released in 2013. Notable examples include: A Photographic History of Oregon State University and Black Quotidian (offering a more custom coded landing page with several entry points).

Several distinguishing affordances of Scalar dovetail with the goals of Dr. Fenton’s scholarship including: the non-hierarchical structuring of navigation paths (inviting–or requiring–visitors to discover the content and meaning for themselves); path-making as narrative-making (offering visitors immersive and experiential understanding); multi-directional tagging (offering many bidirectional avenues for discovery); annotations and search options (offering full text transcriptions of the image artifacts and search capability across either titles and description or a full text search of all fields); and contexts as entry points (offering historical overviews and keyword essays as a part of the scholarly apparatus).

Scalar’s information architecture simulates the familiar table of contents metaphor. The table of contents is globally available upon entering the site from the standardized single entry point button on the landing page.  The latest version, 2.5.14, offers a rich media landing page.  For documentation, the University of Southern California hosts a user guide and an introduction built on the platform itself. 

Three limitations of the current version of the platform are: the level of web accessibility (the WAVE web accessibility evaluation tool currently reports a number of errors on the homepage of Digital Paxton); and customizability is currently achieved for the most part at the code level in Javascript and CSS; the number of 3rd party integrations lags behind other platforms.

Finally, Scalar supports annotation features used by Digital Paxton to enable students in classes to submit transcripts of the text residing in images. As an example of the pedagogical expansions of the website, the challenge of transcribing hand written letters and diaries draws students into the study of palaeography.

All in all, Scalar appears to be a significant step up from other platforms for the immersive experience at scale of digital artifacts and a multiplicity of contextual narratives. Assuming that the advantages of non-hierarchical sequences match the analytical and pedagogical goals of the project, Scalar would seem to be a better choice than Omeka. In my explorations of Digital Paxton I have been drawn into the world of colonial Pennsylvania in a way that I could not imagine possible with a book, whether print or digital, or even a museum. As I explore the significance of the tragic and traumatic events of of the massacre in 1763,  I am intrigued by Dr. Fenton’s theses that the manuscripts tell a different story compared to the printed records and that the massacre by the “Paxton Boys” together with propaganda war created a “template” for the subsequent dispossession of Native Americans from their lands through the terrorism and disinformation of white land hungry settlers and their allies. I look forward to considering Scalar as a platform and to exploring, both as a model and as history, the paths, contexts, and narratives Dr. Fenton has created through this well crafted and engrossing digital space. 

Additional insights and suggestions are available from Dr. Fenton’s slide deck presented at the workshop.

Text Analysis Praxis: An Assessment of Computational Techniques in “A Computational Analysis of Constitutional Polarization”

In a paper published early last year in the Cornell Law Review entitled “A Computational Analysis of Constitutional Polarization”, law professors David E. Pozen, Eric L. Talley, Julian Nyarko describe their efforts to analyze remarks published in the US Congressional Record between 1873 and 2016. Their principle research question asks “whether and to what extent major political blocs in the United States have diverged in the ways they think and talk about the Constitution” (2019, 7). This praxis assignment undertakes a preliminary dissection of the project’s code and data made available by the authors. Through this dissection, it seeks to contribute toward (1) the development of a methodology of critique of computational and statistical techniques and (2) perhaps more importantly a way to ascertain the existence or not of confirmation bias.

While some of the underlying assumptions related to claims of “polarization” and “talking past each other” call for an assessment of the argument’s overall logic, Pozen, Tally, and Nyarko offer an impressively robust set of techniques and methodologies, which incorporate a number of self-critical considerations of their approach and strategies. Included in these considerations are: The attempt to correct problems in the data relating to misspellings and OCR failures; the use of five dictionaries containing varying levels of semantically coarse constitutional terms and n-grams; the use of several classifiers including the Multinomial Naive Bayes classifier, the Multilayer Perceptron classifier, the K-Neighbors classifier, the Gaussian Process classifier, the Decision Trees classifier, and the C-Support Vector Classification classifier; the use of three measures of classifier performance, including the standard rate of correct classification, the F1 measure, and the AUC-ROC measure; the generation of word frequencies and tag clouds; attempts to control for additional variables including the length of remarks; and the comparative analysis of congressional language with language in newspaper editorials.

Pozen, Tally, and Nyarko’s central finding is that “[r]elative to the early and mid-twentieth century, it has become substantially easier for an algorithmic classifier to predict, based solely on the semantic content of a constitutional utterance, whether a Republican/conservative or a Democrat/liberal is speaking” (2019, 4). “Beginning around 1980, our classifier thus finds it increasingly easy to predict the political party of a congressional speaker” (2019, 38). Thus according to the findings of the analysis “constitutional polarization…has exploded in Congress over the past four decades.” The link between predictability of ideology and polarization invites questions about the extent to which “ideologically coherent and distinct” unequivocally translates to “[d]ivision into two sharply contrasting groups or sets of opinions or beliefs” (2019, 34, 8).

Before examining the project’s use of the computational techniques, an overview follows of the provenance of the data. The data used in the analysis–which includes “13.5 million documents, comprising a total of 1.8 billion words spoken by 37,059 senators and representatives”–comes from a dataset prepared by Matthew Gentzkow (member of the department of Economics department at Stanford University and the private non-profit research institute National Bureau of Economic Research (NBER)), Jesse M. Shapiro (a member of the Economics department of Brown University and a member of NBER), and Matt Taddy (affiliated with Amazon) (2019, 18).

For the OCR scans of the print volumes of the Congressional Record, Gentzkow, Shapiro, and Taddy rely on HeinOnline, a commercial internet database service owned by William S. Hein & Co., Inc., based in Buffalo, New York, and which specializes in publishing legal materials.  Gentzkow, Shapiro, and Taddy received funding from the Initiative on Global Markets and the Stigler Center at Chicago Booth, the National Science Foundation, the Brown University Population Studies and Training Center, and the Stanford Institute for Economic Policy Research (SIEPR), and resources provided by the University of Chicago Research Computing Center.

The data provided by Pozen, Tally, and Nyarko consists of a 1.1 GB binary file containing the word embeddings used for the classifier. Additionally, there is a 0.4 MB zip file containing a CSV file for each of the 72 congressional sessions containing the frequencies for the n-grams used for the tag clouds.

Pozen, Tally, and Nyarko apply a number of preprocessing transformations to the corpus, including the creation of word embeddings as a way to correct for misspellings, miscodings, and OCR issues. One transformation the authors did not undertake is the removal of stop words due to the fact that a number of constitutional phrases contain stop words. The following table presents a summary included in their report of the breakdown of the corpus.

Summary Statistics of Congressional Record Corpus

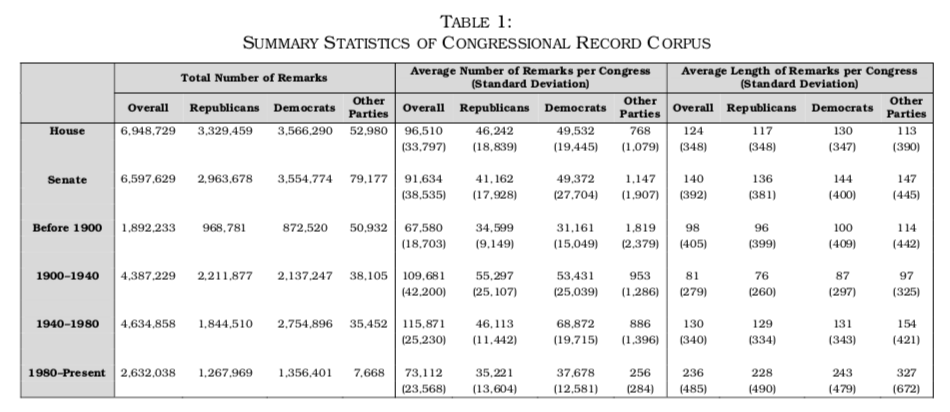
(Click on Image to Enlarge)

While the Python and R code provided by the authors does not run without modification (the Python code is saved to files as Jupyter notebook code blocks), there is enough code that together with the methodology described in the project’s paper enables the discernment of the processing paths and implementation of algorithms. The speeches are vectorized in a pipeline as part of the process of training the models. In terms of predicting the party (Republican vs. Democrat) and ideology (Conservative vs. Liberal), the project uses scikit-learn’s multinomial naïve Bayes classifier as its primary classifier and a cross validation predictor that follows a 5-fold cross validation strategy. The data is split into 80% training data and 20% testing data. The R code is used to create the line charts and scatter plots from the results of the classifications utilize ggplot2 and the cowplot add-on.

The project includes the application of a number of additional computational techniques and secondary findings, including:

  • that polarization has grown faster in constitutional discourse than in nonconstitutional discourse;
  • that conservative-leaning speakers have driven this trend;
  • that members of Congress whose political party does not control the presidency or their own chamber are significantly more likely to invoke the Constitution in some, but not all, contexts; and
  • that contemporary conservative legislators have developed an especially coherent constitutional vocabulary, with which they have come to “own” not only terms associated with the document’s original meaning but also terms associated with textual provisions such as the First Amendment. (2019, 1)

Further evaluation of the project’s code would be needed in order to complete an assessment of the techniques and methodologies underlying these secondary findings.

Conclusion

Through a preliminary evaluation of the code, data, and computational techniques underlying “A Computational Analysis of Constitutional Polarization”, this praxis assignment has attempted a critical assessment of the methodologies Pozen, Talley, Nyarko leverage in their research. While the ample use of self-critical analysis argues against confirmation bias, there would nevertheless appear to be weakness in linking “idealogical coherence” with the claim of “talking past each other”. As one of a number of examples of further research, Pozen, Tally, and Nyarko suggest the application of computational techniques to validate or invalidate the argument made by Aziz Rana that “the culture of ‘constitutional veneration’ is a relatively recent phenomenon bound up with the Cold War effort to justify American imperial ambitions” (2019, 68).

Works Cited
Gentzkow, Matthew, Jesse M. Shapiro, and Matt Taddy. 2018. Congressional Record for the 43rd-114th Congresses: Parsed Speeches and Phrase Counts. Palo Alto, CA: Stanford Libraries [distributor], 2018-01-16. https://data.stanford.edu/congress_text

Pozen, David E., Eric L. Talley, Julian Nyarko. 2019. “A Computational Analysis of Constitutional Polarization” In Cornell Law Review, Vol. 105, pp. 1-84, 2019. SSRN: https://ssrn.com/abstract=3351339.

A vote for a broader structural and institutional understanding of social media and disinformation.

Our sampling of readings related to social media and disinformation help to crystallize a couple of observations: a significant amount of helpful empirical work is being undertaken (some of which argues that not enough data exists to warrant generalizations).  Questions and research related to commercial advertising, media, and social media ownership point to useful lines of inquiry.  However, without a broader contextualization of albeit contested conceptualizations of social institutions and socio-economic structures at the system level that covers the longue durée, empirical work risks putting the cart before the horse or jumping prematurely to symptomatic correlation rather than comprehensive explanation. By placing empirical analysis and research findings regarding disinformation, misinformation, propaganda, and social media manipulation into the broader context of theories of capitalism, neoliberalism, liberal democracy, and mass media, we can avoid the pitfalls of incomplete research.

Perhaps the most fruitful analysis along these lines is the application by Jessica Ringrose of the logics of ‘aggrieved entitled masculinity’ within social media spaces. Building on Kimberlé Crenshaw’s theories of intersectionality, Ringrose points to the “relative degrees of privilege and oppression defined through access to structural power” as factors that help explain the support for racist, misogynistic, and rapist ideologies. Another approach is the attempt to develop propaganda models for mass media, such as the model put forward by Noam Chomsky, Edward Herman, and others. In parallel with empirical research, broader theories reveal how the problems of misinformation in social media are more deeply rooted than the content, the bad actors, and vulnerable communities; when populations establish polities based on a series of myths, the foundations themselves serve as breeding grounds not just for tyranny but for the propagation and acceptance of lies; depending on how we define actually existing democracy, its limited forms of self-determination may reflect deeper vulnerabilities that serve as drivers of some of the observations of empirical research. Explanations of disinformation in social media without problematizing broader frames of reference echo attempts to explain problems in K–12 education. Is it the teachers? Is it the school system? Is it the curriculum? Is it the family? Or is it all of the above the larger context of the political economy, the broader socio-economic imbalances enforced by regimes of capitalist controlled markets, and obstacles to fundamental constitutional reform?

What is (a) text? Another attempt…

As a followup to our class discussion, I attempt another provisional proposal of text as:

“a preserved or remembered piece of human language”

(My apologies for the raw and unstructured bullet points.)

  • “Preserved” also encompasses a piece of human language that is merely rememberable or remembered.
  • Texts are reducible to symbols (as described by Bianca’s expansion of semiotics and signs) that are predominantly but not exclusively mediated linguistically, i.e. communication facilitated by the larynx, the tongue, and the inner ear, as opposed to predominantly mediated visually with the eyes, and which have a linguistic grammar (morphology and syntax).
  • Visual media (which is increasingly audiovisual), while sharing symbolic foundations with text, operate through a non-linguistic symbolic grammar and are not text.
  • While imagery may not be, in and of itself, text, it would seem that all symbols and signs maintain a context which carries the possibility for narrative and some degree of textuality.
  • Class discussion exists as a text as long as we remember the class as a piece of human (linguistic) language. Conversely, a piece of human (linguistic) language that is not remembered (and only momentarily interpreted) is not a “meaningful” text, but may be an “ephemeral” text. This is not to say that ephemerality is not meaningful. It is simply to say that the transitory nature of communication and attention assigns meaningfulness to a ratio of signal vs. noise.
  • If any piece of language is remembered in the unconscious, pieces of language in the unconscious may become “conscious” text when they re-enter consciousness.
  • Texts encompass:
    • Any linguistically constructed (and linguistically interpreted) symbols before the advent of oral literature.
    • Any oral literatures, such as Vedic chants and homeric hymns before the advent of writing.
    • Akkadian cuneiform tablets of non-narrative numerical accounting.
    • Undeciphered scripts of pictograms, logograms, and ideograms such as perhaps the scripts of the Harappa and Mohenjo-daro cultures. As undeciphered scripts are deciphered the degree of textuality and linguistic interpretability increases.
  • The characteristic of being remembered (or preserved) bestows the possibility of some form of consideration however slight or however involved. It is this possibility of consideration, interpretation, or mental (or computerized) processing that brings a piece of (linguistic) language into being as a “meaningful” or “ephemeral” text.
  • Is a linguistic utterance momentarily a text during the instantaneous act of interpretation? The answer must by yes. Ephemeral texts are constantly and instantaneously coming into being and out of being as we communicate.  What is “ephemeral” may at any moment become “meaningful” depending on the extent of consideration.
  • If human (linguistic) language is implicated in the existential mess (in relation to the untold worlds of unnecessary suffering and enforced trauma), is it not reasonable to assume that human (linguistic) language (especially as text) holds the potential to help us find a way out? Following Kevin’s remarks on the implications of text in erasures and oppressions, text and visual media carry the afterglow of the misuse of human tools, which are in and of themselves neither harmful nor harmless.
  • Visual Imagery not constructed or interpreted linguistically is not text.
  • To the extent that non-representational art may exist, non-representational art is not, in and of itself text.

Are the following artifacts:

1. Text or Not Text (binary)?

2. Maintain degrees of textuality (non-binary)?

(in the sense of either the representational recordings or in the sense of the actual communication going on)

Can a specific set and hierarchy of symbols (of an empire) be considered a text?

Flags of UK and Its Colonies

Can both a logogram or an image of the Buddha be considered a text?

Buddha in Chinese and Image of Buddha Statue


Can the communication going on between ants be considered text?

Ants Communicating


Can the communication that goes on between a human and an animal be considered a text?

Communicating with a Dog

Text Analysis, Structural Power, and Structural Inequalities

Lauren Klien’s “Distant Reading after Moretti” offers a number of points of departure relating to the humanities as a whole, particular disciplines, and the general nature of computation. As an expanded version of our reading “Gender and Cultural Analytics: Finding or Making Stereotypes?”, Klien references Laura Mandell’s revelatory presentation in 2016 at the University of Michigan Library.  In the presentation, Mandell expands her analysis of gender and stereotypes to include discussions about Google and various OCR efforts.  Her exposures of major biases that completely distort interpretations and studies related to gender, and which occur at all levels of textual research and analysis from the problems of optical character recognition to the misuse of statistical techniques, argue for the importance of carving out an entire subfield or ongoing set of research initiatives dedicated to the critique of computation, along the lines of critical computation studies.

Not all schools of thought within the humanities may advocate for “connect[ing] the project of distant reading to the project of structural critique” or for actively supporting demands for social justice prompted by institutionally sanctioned practices of abuse and dehumanization within academic organizations. But given an academic landscape characterized by humanistic pluralism, scholars such as Klien and Mandell point to the possibilities of building forceful and lasting foundations of rigorous and critical scholarship for academic communities committed to socially engaged and progressive values, foundations which can serve as the leading-edge in the project of exposing and interrogating power.

As one example of how the debates about representativeness, statistical significance, and bias in textual corpora can help methodological critiques in other disciplines, the ways in which historians generalize with broad brush strokes using terms such as “everyone” or “no one” in relation to an entire polity or culture appear less defensible given the construction of albeit problematic digital archives totaling potentially billions of texts and artifacts. Important and crucial skepticism about the archiving and analysis of texts leads to important skepticism about generalizations and abstractions, whether theoretical or empirical, quantitative or qualitative.

In terms of the nature of computation in general, questions that come up include: Is there hidden performativity behind the act of enumeration that gives quantitative analysis the chimera of ideological prestige? To what extent if any do the socially constructed dichotomies between computational work and the traditional work in the humanities (or between the digital and the analog, etc.) reflect the functions class, gender, race, and education within the context of private capital accumulation? Ted Underwood and Richard Jean So underscore the value of experimental, iterative, and error-correcting models and methodologies in computational research. To what extent would a commitment to these approaches address the issues Mandell raises about the problems of text as data regardless of computational techniques?

Thank Goodness for the Wayback Machine

Peter Suber’s “Green”, “Gold”, “Gratis”, and “Libre” open access taxonomy points to how the emancipatory upside of technology continues to break down the proprietary barriers of the Ancien Régime’s enclosures. While the startup world and the world of mergers and acquisitions continue to monetize the latest convergences of technology sectors from the top, parallel convergences emerge from the bottom up as increasingly interdependent communities of workers construct transparent knowledge stacks of open access layers built over free and open source software (including open-source hardware). Suber’s impressive efforts dovetail with a long list of precedents in technology including Richard Stallman (Free Software Foundation), Linus Torvalds (Open Source Software), and even perhaps counter-intuitively Phil Zimmermann (Pretty Good Privacy encryption). There are, however, a variety of often conflicting ideologies reflected throughout the subversive knowledge stack. Stallman’s strict legalism and  communitarian framing of the “freedom to run, copy, distribute, study, change and improve the software” contrast with the libertarian and civil libertarian ideas of figures such as Eric Raymond (author of The Cathedral and the Bazaar) and John Gilmore (Electronic Frontier Foundation).

Suber’s advocacy of free and open repositories for “libre” knowledge would seem to serve as an effective and practical agenda for the humanities and the larger world of education. Suber states that “the ultimate promise of OA is not to provide free online texts for human reading, even if that is the highest-value end use. The ultimate promise of OA is to provide free online data for software acting as the antennae, prosthetic eyeballs, research assistants, and personal librarians of all serious researchers” (122). While Suber’s vision has the ring of science fiction, especially given the chaotic plethora of siloed databases, changes driven by pragmatic needs for integration and more human centered search tools are year-by-year blurring the lines between reality and imagination. To the extent Suber’s vision is a premonition of things to come, it offers opportunities for re-imagining the role of publishers and their business models. What stands in the way of the convergence of business models for digital goods and services with the interests of the public domain?

In contrast to Suber’s optimism for an OA future and its associated technologies, Johanna Drucker’s cautionary rendering of the “shiny red object” syndrome and the “innovation bandwagon” offers an important tonic and reminder of the human in the digital humanities. Yet Drucker’s nostalgia for the goodwill of wealth hoarding tycoons such as Andrew Carnegie leave today’s generation waiting for Jeff Besos, Tim Cook, and the absurd appearance of Beckett’s Godot. Drucker incisively argues that, despite so many hopes and efforts to the contrary, technology is not the “panacea” for resolving the crises of digital publishing, whether academic or trade. In advocating for alternatives to Google, such as the Digital Public Library of America, Drucker also points toward non-proprietary, free, gratis, and libre applications such as LibreOffice, Gimp, and Audacity.

Given Drucker’s sobering criticisms, the options offered seem underwhelming. Much of the highest managerial strata of the publishing and media industries are still stuck in an older pre-digital world, preferring to kick the proverbial can down the road. New approaches are likely to be considered as the MP3 generation takes over. A fundamental problem would seem to lie in what Walter Benjamin intimated in 1936 in “The Work of Art in the Age of Mechanical Reproduction”, namely that “[t]o an ever greater degree the work of art reproduced becomes the work of art designed for reproducibility” (225). Monetization can no longer be based on physical irreproducibility and scarcity. Moreover, “[f]ascism attempts to organize the newly created proletarian masses without affecting the property structure which the masses strive to eliminate” (241).

In the meantime perhaps some of the most important digital repositories will continue to be sites such as the Internet Archive (archive.org) and The Wayback Machine (waybackmachine.org), which as the number of broken links explodes increasingly becomes the recovery mechanism for a broken public memory.

Works Cited

Benjamin, Walter. 1969. Illuminations. New York: Schocken Books.

Suber, Peter. 2012. Open Access. Cambridge: The MIT Press.

Animated Bar and Pie Chart Using Flourish

UNDP Human Development Index 1990-2017 (click image to view animation)

Animated Bar Chart for UNDP Human Development Index 1990–2017


US Census – Race and Ethnicity 1950–2060 (click image to view animation)

Pie Chart for US Census - Race and Ethnicity (working draft)


Overview

Animated bar and pie charts attempt to narrate and reveal the changing relationships between variables, attributes, or features of a set of interpolated time series, and in the process identify historical trends.

Discussion

For the bar chart entitled “UNDP Human Development Index 1990-2017”, data was retrieved from the United Nations Development Program (http://hdr.undp.org/en/data). As a measure of human development in terms of a combination of indicators of life expectancy (based on the indicator of life expectancy at birth), education (based on indicators of expected years of schooling and mean years of schooling), and per capita gross national income (based on the indicator for GNI per capita), the HDI attempts to improve on older measures centered around income. The chart using country level data was too detailed and did not readily display any discernible insights. By zooming out and using regions and other summary categories, the animation increased to a level that resulted in meaningful trends beyond country-by-country rankings.

For the pie chart entitled “US Census – Race and Ethnicity 1950–2060”, data from the U.S. Census Bureau was retrieved for the breakdown of the US population by race and ethnicity between 1950 and 2060. Due to issues related to the changing definitions and questions for race and ethnicity, percentages for each year do not add up to 100%. When data categories change, the pie chart is an improvement over line charts in which time series do not uniformly cover the same time periods.

The London-based company behind these animated charts is Flourish (https://flourish.studio/), which is a registered trademark of Kiln Enterprises Ltd. The company targets agencies and newsrooms and offers discounts to non-profits and academic institutions. The freemium version requires that all charts be made publicly available. The personal subscription plan starts at $69 per month. The learning curve of the user interface is impressively low. Customization of charts is extensive, including multiple variables for font sizes, colors, captions, labels, legends, layout, number formatting, animation rates, headers, and footers. The company offers a wide range of visualization templates, including a variety of projection maps, scatter plots, 3D maps, hierarchy diagrams, marker maps, cards, 3D globes, photo sliders, network graphs, team sports visualizations, arc maps, and others. In addition to one-off visualizations, the application offers “stories”, which are animated presentations of one or more visualizations.

Challenges

US Census bureau historical data and projections present challenges resulting from the changes over time in the definitions of categories and questions. Both visualizations present issues with interpolation that hide unrepresented data. UNDP data presents issues related to hidden variability of indicators for demographic characteristics such as gender, race, ethnicity, age, and others with the geographic domains.

Conclusion

The animated bar chart for HDI suggests that while human development has gradually improved over time for all regions and categories, improvements relative to other regions have only occurred in the regions with middle values. The lowest HDI category (low human development) and highest HDI category (OECD) have not changed rank relative to the other categories. The lowest HDI category has only marginally changed relative to the highest category. Overall, regions have not shifted markedly in rank. Introducing other categories including “Global North” and “Global South” would help to reveal trends relevant to contemporary social, political, and economic analysis.

The animated pie chart visually demonstrates the decreasing white share of the population relative to the increasing non-white share of population. The point at which the white share becomes less than 50% appears around 2040. This could arguably be one of the most powerful explanatory demographic trends in contemporary US history. Explanatory power arguably represents a key measure of a successful visualization.

As a for-profit company, Flourish is potentially subject to constraints that run counter to the values and mission of the digital humanities and higher learning. To the extent open source software managed by non-profit associations and non-governmental organizations can replicate proprietary software applications, Flourish offers a model of a successfully hosted charting and visualization application.

When used carefully, visualizations offer opportunities to make compelling arguments about the state and nature of any phenomena that can be counted or perhaps merely represented. The most compelling visualizations are arguably those that reveal new insights well beyond the initial moments of comprehension. These kinds of visualizations invite iterative analysis in which changes in context or new information lead to new understandings. There are many risks, however, in attempting to argue and narrate through visualizations. Data visualizations can easily lead to distortions, omissions, and erasures as a result of either the data or its presentation. As with any powerful technology, critically informed experience and skill potentially lower the risks. As visualization tools and applications become more widely available, the need increases to disseminate an understanding of the hidden assumptions, distortions, and false representations embedded in data and its display.

Recovering Value and Growth through Design and Infrastructure

Our readings on design and infrastructure, especially the interventions of Bethany Nowviskie regarding a DH feminist ethic and praxis care and of Steven Jackson regarding broken world repair, carry far-reaching and hopeful (if not therapeutic and exhilarating) implications for the necessity and possibility of an ongoing recovery from Walter Benjamin’s “wreckages” of “progress”. In highlighting these two interventions, one could consider Susan Star’s ethnography of infrastructure, Miriam Posner’s archeology of supply chain management, and Ernesto Oroza’s technologies of disobedience as clear and concrete applications of an enveloping theory and practice of care and repair. They also offer the solid grounding needed to address the increasingly urgent need to contextualize the untenable implications of the Anthropocene. In re-appropriating design and infrastructure through a theory and practice of care and repair, might one possible outcome be a radical reconceptualization of value and growth, whose spectacular commodifications have long fueled the cosmologies and cults of the entrepreneur, the tech innovator, and the securities speculator?

Instead of representing the instrumentalising product of extraction and exhaustion, value becomes a measure of “context, interdependence, and vulnerability”. Instead of representing an unsustainable increase in the output of waste, goods, and services, growth becomes a measure of the recuperative homeostasis relative to biospheric metabolisis. In just twenty-six years Amazon, Inc.’s revenue has gone from $0.00 to $88.912 billion and its gross profits in the last ten years have gone from $6.0 billion to $129.6 billion. Even more astounding is the growth of Amazon’s information technology and computing infrastructure services, Amazon Web Services (AWS), which since launching a mere 14 years ago in 2006, have reached $35.0 billion in revenue. The infrastructure powering this so-called “growth” can only be compared to industrialization itself, with the profound difference being that never-ending growth has now exhausted the capacity to absorb the consequences of older notions value and growth.

In reflecting on Maggi’s comments on the benefit and importance of transparency, perhaps now is as good a time as ever to extend Marx’s call for a “ruthless criticism of everything existing” to a “ruthless transparency of everything existing”. Technology and infrastructure can become disobediently “smart” and “transparent” when they are fully backwards compatible and adaptive. (Instead of innovating for planned obsolescence, “smart” technology works on the oldest devices, with the oldest infrastructures, in the least technological environments, and with the availability of all of its versioned interfaces and affordances.)

Polemics and Explanatory Power in Arguments and Archives

Depending on which event we choose as the starting point, the Internet and its associated technologies have been around for approximately forty to fifty years. Given that we are still in the Internet epoch’s early stages, it is not surprising that with the severity of the consequences we witness angst, questioning, and debate as the flying debris and dust storms take their time to settle (if they ever will settle). When combined with the Internet’s socio-economic consequences, digital technologies have rightly unsettled higher education and in some respects provoked an identity crisis. For those who see disturbances and identity crises as a setback, the inclination understandably arises to fight for the primacy of older traditions. For those who question many of the assumptions of both the role of the university in the past and in the present or who simply see the causal relationships between the activities of the academy and social inequities and harms, the new technologies present opportunities for re-inventing higher learning along the lines that more closely align with the best values of the human being as a species. It would thus seem to be a reasonable and arguably healthy outcome for higher education to experience an increase in the level of polemical discourse and scholarship especially during a time of social upheaval.

Without sufficient polemic debate, currents of thought turn into stagnant doldrums. Polemic discourse in the best case scenario reflects commitment, concerns, and the notion that there is something at stake. On the other hand, too much polemic discourse results in debate that loses sight of larger issues and questions. (One wonders if the failure of professors and researchers in higher education to organize to create one big union that can take power back from administrators and non-academic interests is not to some extent a reflection of the adverse consequences of polemics). The impact of new technologies on research and scholarship present opportunities to polemically interrogate the role of the archive and archival work.

To some extent Cameron Blevins’ plea for “argument-driven” scholarship might appear to be a call to revive an older orthodoxy, which at the risk of exaggeration sees the university as safe haven where experts, having dedicated the bulk of their productive lives to specialized topics, fight out their battles in journals that maintain the cycles of thesis assertions, claims, defenses, disputations, and refutations. Both Jessica Marie Johnson and Marlene L. Daut propose important programs for archival work that could be interpreted as “argument-driven” scholarship depending on how we understand what we mean by “argument”. Their polemics raise the issue of which arguments are the most valuable to make and which arguments lead higher education down the path to its irrelevancy or still worse its active and passive roles in abetting systems of genocide, oppression, and exploitation.

It would seem that the “newness” of information technologies masks the fact that similar questions and debates about the archive and archival work have been part of intellectual and academic labor for centuries. One example that comes to mind is the critique of archival interpretation in the seventh chapter of The Making of the English Working Class, in which the  historian E.P. Thompson takes his colleague, fellow historian Sir John Clapham, to task for fallaciously arguing that workers were not affected by the enclosures that pushed them into immiseration and the cruelties of the urban factory systems. Thompson published his book in 1963, six years before the delivery of information over the first interconnected computers at UCLA and Stanford University and twenty-six years before Tim Berners Lee designed the protocol and language for interconnecting electronic documents. Thompson writes:

Throughout this painstaking investigation, the great empiricist eschews all generalisations except for one–the pursuit of the mythical “average”. In his discussion of agriculture we encounter the “average farm”, the “average small-holding”, the “average” ratio of labourers to employers–notions which often obscure more than they reveal, since they are arrived at by lumping together evidence from Welsh mountains and Norfolk corn-lands which Clapham himself has been at pains to distinguish. We go on to encounter “the average cottager an area affected by enclosure” the “average” loss to rural earnings from industrial by-employments, the gross earning of “that rather vague figure, the average English (with Welsh) labourer”, and so on. We have already seen that this “averaging” can give us very odd results: the 60% of the labourers who, in 1830, were in low-wage counties which fell below the “average” line.

Now what is being averaged? The first part of this statement might be of some value if it could be shown that in the same villages where cottage gardens were lost potato patches come in (although we should also examine relative rents). But the second part, which has already passed into comfortable tradition, is not an example of averaging but of statistical dilution. We are being invited to dilute the figure for those parts of Britain where enclosure did take place with those where it did not, divide the sum of this weak solution by the number of counties, and come up with an “average” loss in well-being “due to enclosures”. But this is nonsense. One may not take an average of unlike quantities; nor may one divide quantities by counties to arrive at an average of value. This is what Clapham had done.

What he was really doing, of course, was to offer a tentative value judgement as to that elusive quality, “well-being”, in the period of maximum enclosure. But to do this, very many more factors–cultural as well as material–should have been brought to bear upon the judgement. Since the judgement springs like an oak out of such a thicket of circumstantial detail–and since it is itself disguised as an “average”–it is easily mistake as a statement of fact (Thompson 214-15).

Questions about the accurate meaning of the archive and the effective use of the archive to advance claims have been a part of academic work long before the Internet arrived. Public archival work has also been a part of the landscape for a significantly long time as is evidenced by the more than 10,000 historical societies in the US alone. Argument-driven digital scholarship is surfacing more and more as can be seen by the debates surrounding the online digital essay The 1619 Project (2019). In this case, an older generation of historians were inspired to dispute claims that the struggle for the independence of the British colonies in North America represented significantly enough an effort to protect the institution of slavery. To some extent it is up to argument-driven scholars to engage with claims conveyed through digital technologies. As more and more scholars become internet literate, new digital spaces along with older journals will serve as forums for debate. In the meantime, archival scholars are taking advantage of the capabilities new technologies offer in facilitating the wider and more open dissemination of historical information.

In support of Blevins’ argument, it is the explanatory power of argument-driven historical research and writing that perhaps offers the most important contribution to higher education, culture, and society. Much of the continuing injustices and social ills can be traced to institutions that have roots in events and developments many centuries ago. If we look only to the current moment for explanations we are likely to miss the deeper regimes that enforce the patterns shaping and determining the world we live in. Explanatory power derives from both careful and critical arguments, balanced polemics, and careful and critical publication of digitally reproduced primary sources.

Works Cited

Project, The 1619. 2019. “The 1619 Project” in The New York Times. New York: The New York Times Company.

Thompson, E.P. 1966. The Making of the English Working Class. New York: Vintage Books.