Author Archives: lane vineyard

Interactive Mapping Workshop

Yesterday I had the opportunity to participate in the Intro to Making Interactive Maps workshop which was expertly led by Olivia Ildefonso. The workshop was targeted to those who are interested in creating interactive maps but have little to no experience with marrying multiple datasets, creating intricate layers and executing a map that informs its viewers by telling a story. As someone who has scarcely any mapping experience aside from the two maps that I’ve created for assignments at the Graduate Center, I was a bit worried that I’d easily get lost or confused during the session. But I found that the workshop really catered to every participant regardless of amount of prior experience with mapping tools or lack thereof.

The workshop consisted of two parts: a presentation that included some crucial information on the basic fundamentals of interactive mapmaking as well as an overview of the map we were creating, and then hands-on experience making said map. One point I found really helpful in the presentation was how to determine what kind of mapping tools use. Olivia explained that the tools you use depend on whether the map you’re creating is going to be static or interactive. Additionally, your intended budget is another important factor, and combining data on multiple mapping tool such as ArcGIS and QGIS is common as they’re more accessible than some pricer tools. After discussing mapping techniques, exploring different tools and defining different kinds of data often found in interactive maps, we were able to try our hand at creating an interactive map.

Creating the Map:

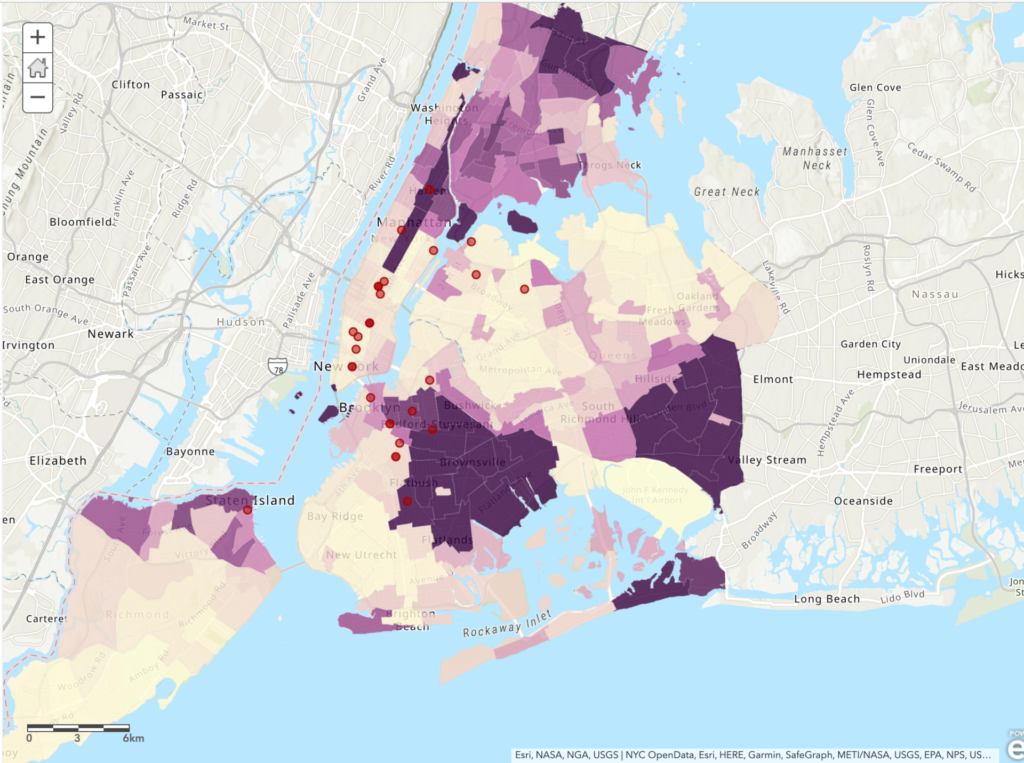
The map we created mapped out 1 week of BLM protests in New York City, based around the research question: Do New York City’s BLM protests tend to take place more in majority Black neighborhoods or in majority non-Black neighborhoods? Olivia provided us with data including shapefiles for NYC boroughs, locations of protests and the percentage of race by neighborhood. We transferred this data over to ArcGIS and then were able to play around with color schemes, symbols, and the overall aesthetic of the map. Additionally, some of the data provided included specific details for protest locations and powerful images for each location, which we were shown how to add to our map points. I was truly impressed by how a string of data can be visualized (seemingly) seamlessly into locations, images, and points on a map.

Conclusion

To me, mapping is an art, and one that I have been interested in for years. With no experience, however, I admit I was initially daunted by it; I had no idea where or how to get started. This workshop made me feel very comfortable with ArcGIS and excited to create my own mapping projects in the future. Next, I’m excited to learn more about the actual process of finding data and preparing it for the mapping process.

If you’re interested, you can check out the map here 🙂

Visualizing Languages Requested by Non-English Speaking New Yorkers Filing for Bankruptcy

Before settling on this specific topic, I already knew that I wanted to explore data that dealt with language, in particular data that showcased the linguistic diversity of New York City. As a self-professed language nerd, I often find myself doing my own research on the role that language plays in the US and as of recent how non-English speakers navigate an English-dominant country and workforce. Initially I opted to visualize in a chart the percentage of languages spoken by New Yorkers, but then decided that I wanted to dig a bit deeper. I’m more so interested in how the presence of these myriad languages is showcased in different situations, whether that be an everyday interaction or something a bit more complex such as filing for bankruptcy.

After searching for language related datasets on data.world, I discovered that the Language Assistance Program released monthly reports of US citizens who filed for bankruptcy and requested translators for their meeting with creditors due to limited English proficiency. Upon request, these individuals were provided a phone call with an interpreter that spoke their preferred language. The most recent month available on data.world was for the month of May in 2017 so that is the dataset that I selected. Additionally, this dataset recorded individuals from nearly every major US city but for this assignment I wanted to focus solely on New Yorkers. As the Language Assistance Program was releasing monthly datasets, the languages listed tend to differ with each month. In this specific month, the languages that were requested by individuals filing for bankruptcy were Albanian, Bengali, Cantonese, Korean, Mandarin, Polish, Punjabi, Romanian, Russian and Spanish.

To create my chart, I transferred my chosen data -the requested languages, collective call duration with interpreter for each language, and whether the calls took place in what the dataset listed as either New York (Manhattan) or Brooklyn – into an Excel sheet, and from there transferred it to Tableau. I ultimately selected this chart as I thought that it best showcased the information. Based on the chart, it’s evident that some languages like Spanish are more recurrent and are present in both locations, while other languages like Cantonese only appear one or two times and only appear in one location. However, as I have only visualized a single month for this assignment, I feel that I do not have sufficient information to make any hypotheses or have any solid takeaways based on the dataset. The next steps I’m going to take is gather more data from previous posts by the Language Assistance Program, visualize them into charts and compare the information, specifically looking for patterns in recurring languages and call durations.

Map of Reported LGBTQ Hate Crimes in Tennessee

I want to begin my post by admitting that this project was a bit challenging for me, specifically in terms of choosing and finding data for my map’s principle focus. For hours I racked my brain for focal topics, something that not only resonates with me but could also be converted into mappable data. Inspired by experiences of both myself and myriad close friends who grew up in my home state, I eventually landed on this topic: mapping recent LGBTQ hate crimes in the state of Tennessee. Tennessee along with many other states located in the Southeastern region of the United States pride themselves on a ubiquitous welcoming and hospitable culture that extends kindness to all. I’ve always appreciated this philosophy and find this mindset has positively affected my interactions with those around me. However, growing up as a queer person in rural Tennessee revealed to me at a young age that often this allegedly universal ‘Southern hospitality’ isn’t extended to every community. Whether bullying, verbal or physical assault, myself and countless others were not safe from the prejudice and discrimination rampant in my hometown. This is an issue that I ignored for years; after weathering slings and arrows for the majority of my childhood, I developed a dissonance from this ongoing issue, unconsciously attempting to separate myself from my community in order to protect myself. Now that I’m older, I’ve dealt with my past experiences and now hope to do more research on this topic with intentions of revelation and eradication of the intolerance that is so prominent in the South. Recently on social media, I have seen countless joking that the South is unfixable, it’s inherently corrupt and should be separated from the rest of the United States. However, joke or not, I find these statements extremely problematic, as they minimize the experience and plight of so many fighting for change. Queer people do exist in the South, innumerable members of the LGBTQ community are fighting passionately for positive change and safety in their own towns as well as recognition of the impact of queer Appalachia in the South.

I found my data on the Tennessee Bureau of Investigation site, looking through reported hate crimes in the year 2018. This is the most recent year I was able to find this information readily available, so I do plan on doing further research to compare the numbers in both 2019 and 2020. I transferred the data from this site to an Excel sheet, separating them into categories of the county/city where the hate crimes were reported, the latitude and longitude and the number of hate crimes reported in each area listed. Initially, I was stuck on how to map out my data, but through helpful Youtube videos I was able to make progress. Notice that on the map, larger circles indicate which areas had multiple reported hate crimes in 2018. Moreover, the varying colors of the circles also reflect the amount of reported hate crimes. I’d like to point out that the hate crimes on the Tennessee Bureau of Investigation did have different forms of LGBTQ hate crimes separated into the following categories: Anti-Bisexual Bias, Anti-Gay Bias, Anti-Lesbian Bias, Anti-LGBT Mixed Group Bias, Anti-Transgender Bias and Anti-Gender Non-Conforming Bias. However, as this is my first mapping project, for this assignment I grouped all cases together as these categories can all be considered part of the LGBTQ community. I plan to continue this project with distinct separations that note the experiences of each allotted community. Additionally I’d like to note that this resource did not distinguish the race or ethnicity of the victims of these specific hate crimes. Therefore, I plan on doing further research focused on the percentage of individuals who have experienced LGBTQ hate crimes that are BIPOC, as homophobia and racism are undoubtedly linked and the discrimination experienced by white queer folks is much different than that of queer BIPOC.

I thoroughly enjoyed this assignment. I am aware that this is not the most informative or visually stimulating map, but I’m excited for future mapping projects where I can improve my visualization of datasets and add more layers of necessary information. Moreover, I’m looking forward to doing further research on the topic of the queer Appalachian experience and finding ways to visualize it using digital humanities tools.

Here is a link to the map on Tableau: https://public.tableau.com/profile/lane.vineyard#!/vizhome/Book4_16013334881130/Sheet2?publish=yes

How DH Empowers Others

Exploring the sites after completing the readings was extremely helpful for me in terms of solidifying a definition of digital humanities, or rather exemplifying just how flexible or “infinitely malleable” this definition is. Navigating each site, a question that was proposed in “A DH That Matters” continually came to my mind: â€śHow can digital humanists ally themselves with the activists, organizers, and others who are working to empower those most threatened by [the charged environment of 2019?]” Beyond that question, I kept asking myself how digital humanists could utilize this field to not only inform and uncover problematic patterns in the data that further promote the disenfranchisement of marginalized groups, but how can we use our resources to promote change as well.  

I found Torn Apart/Separados to be a response to these proposed questions. It exposes the insidious financial regime of ICE, revealing myriad well-known political figures and companies who both profit and participate in ICE operations. It simultaneously provides information on notable allies along with links to their sites where those interested can learn more or donate to their cause. To me, Torn Apart/Separados is illustrative of the digital humanities that was defined in our readings; through the visualization of various sets of data into various charts, it informs while also providing resources that can be used to fight against this regime by means of donating to allies or no longer supporting companies that contribute to the problem.  

Another aspect of DH that is so appealing to me is just how capacious it is. Moreover, Spiros noted how DH should promote values like collaboration, openness and diversity among others. While Torn Apart/Separados is illustrative of DH, so is every other site in its own specific way, appealing to one or more of the various sub-fields within DH. This push for group collaboration and openness is exactly what drew me to this field, as I think it cultivates an open, flexible environment where digital humanists will continue to develop and evolve the ways in which we navigate academia, research, and empowering others.