
I want to begin my post by admitting that this project was a bit challenging for me, specifically in terms of choosing and finding data for my map’s principle focus. For hours I racked my brain for focal topics, something that not only resonates with me but could also be converted into mappable data. Inspired by experiences of both myself and myriad close friends who grew up in my home state, I eventually landed on this topic: mapping recent LGBTQ hate crimes in the state of Tennessee. Tennessee along with many other states located in the Southeastern region of the United States pride themselves on a ubiquitous welcoming and hospitable culture that extends kindness to all. I’ve always appreciated this philosophy and find this mindset has positively affected my interactions with those around me. However, growing up as a queer person in rural Tennessee revealed to me at a young age that often this allegedly universal ‘Southern hospitality’ isn’t extended to every community. Whether bullying, verbal or physical assault, myself and countless others were not safe from the prejudice and discrimination rampant in my hometown. This is an issue that I ignored for years; after weathering slings and arrows for the majority of my childhood, I developed a dissonance from this ongoing issue, unconsciously attempting to separate myself from my community in order to protect myself. Now that I’m older, I’ve dealt with my past experiences and now hope to do more research on this topic with intentions of revelation and eradication of the intolerance that is so prominent in the South. Recently on social media, I have seen countless joking that the South is unfixable, it’s inherently corrupt and should be separated from the rest of the United States. However, joke or not, I find these statements extremely problematic, as they minimize the experience and plight of so many fighting for change. Queer people do exist in the South, innumerable members of the LGBTQ community are fighting passionately for positive change and safety in their own towns as well as recognition of the impact of queer Appalachia in the South.
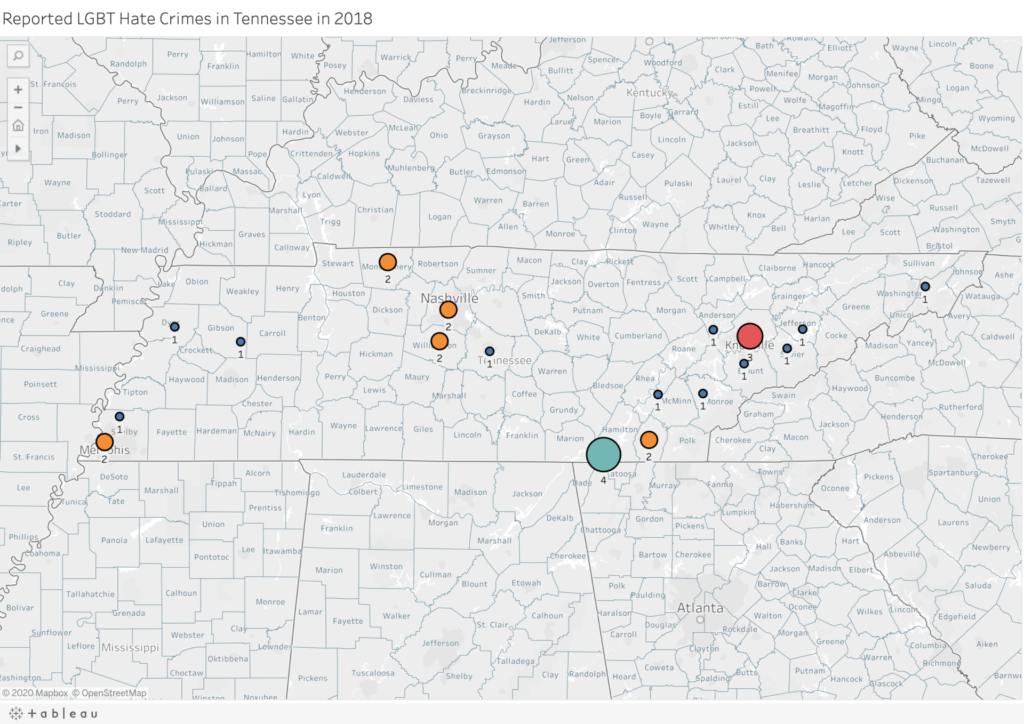
I found my data on the Tennessee Bureau of Investigation site, looking through reported hate crimes in the year 2018. This is the most recent year I was able to find this information readily available, so I do plan on doing further research to compare the numbers in both 2019 and 2020. I transferred the data from this site to an Excel sheet, separating them into categories of the county/city where the hate crimes were reported, the latitude and longitude and the number of hate crimes reported in each area listed. Initially, I was stuck on how to map out my data, but through helpful Youtube videos I was able to make progress. Notice that on the map, larger circles indicate which areas had multiple reported hate crimes in 2018. Moreover, the varying colors of the circles also reflect the amount of reported hate crimes. I’d like to point out that the hate crimes on the Tennessee Bureau of Investigation did have different forms of LGBTQ hate crimes separated into the following categories: Anti-Bisexual Bias, Anti-Gay Bias, Anti-Lesbian Bias, Anti-LGBT Mixed Group Bias, Anti-Transgender Bias and Anti-Gender Non-Conforming Bias. However, as this is my first mapping project, for this assignment I grouped all cases together as these categories can all be considered part of the LGBTQ community. I plan to continue this project with distinct separations that note the experiences of each allotted community. Additionally I’d like to note that this resource did not distinguish the race or ethnicity of the victims of these specific hate crimes. Therefore, I plan on doing further research focused on the percentage of individuals who have experienced LGBTQ hate crimes that are BIPOC, as homophobia and racism are undoubtedly linked and the discrimination experienced by white queer folks is much different than that of queer BIPOC.
I thoroughly enjoyed this assignment. I am aware that this is not the most informative or visually stimulating map, but I’m excited for future mapping projects where I can improve my visualization of datasets and add more layers of necessary information. Moreover, I’m looking forward to doing further research on the topic of the queer Appalachian experience and finding ways to visualize it using digital humanities tools.
Here is a link to the map on Tableau: https://public.tableau.com/profile/lane.vineyard#!/vizhome/Book4_16013334881130/Sheet2?publish=yes

This entry is licensed under a Creative Commons Attribution-NonCommercial-NoDerivatives 4.0 International license.