
My Map:
My map visualizes the quantity of retail food stores across select counties of New York (Bronx, Queens, New York, Rockland, and Westchester) using Tableau’s 14-day free-trial of the software.
I decided to explore NYC’s 2020 Open Data projects database (via its website and GitHub) in the area of agriculture and markets due to the reliability of this information. Open access food-data, so to speak, is already regulated through The New York State Department of Agriculture and Markets (when pulling from Open Data), and the literature on the topic in the region is sizable, given the role of environment on food sources in the City. The reliability, presence of detailed information, and integrity of Open Data made mapping this topic viable for the purpose of the assignment.
What my map shows:
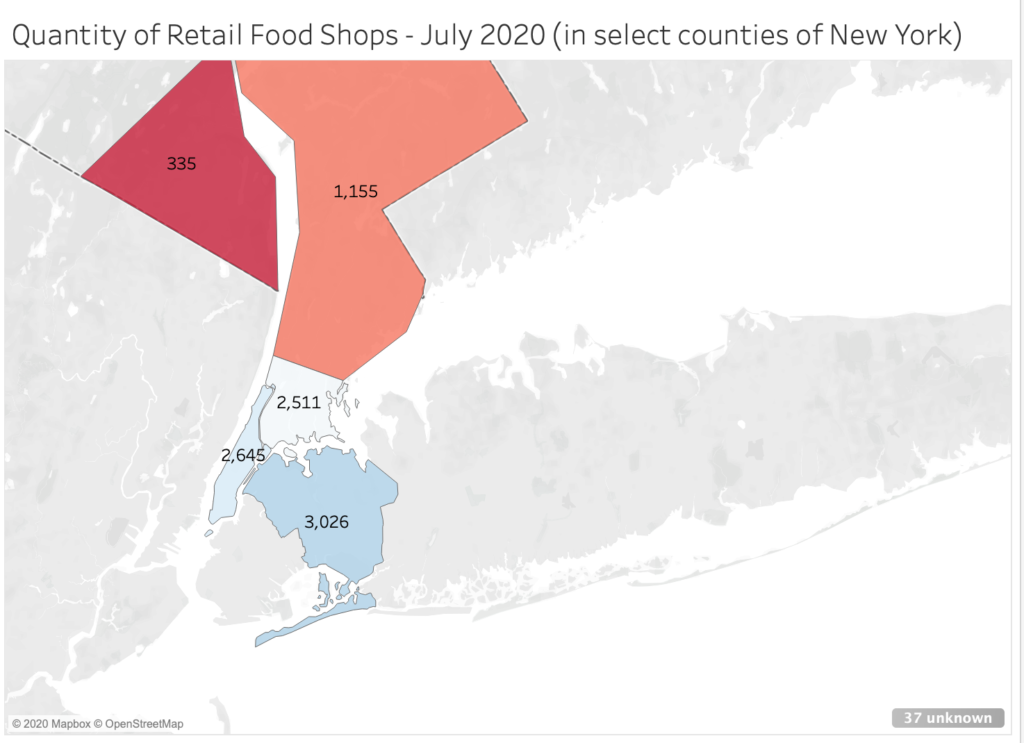
My map visualizes the quantity of food shops across five counties, which include supermarkets and small shoppes (delis) that can be indexed in the City and Department of Agriculture and Markets’ databases as of July 2020.
I used a gradient to scale results:
- blue to cerulean: a high quantity of food shops;
- white, orange, and light-red: moderate quantity of food shops;
- red to crimson: lower quantity of food shops.
Queens (3,026) ranked first in this set for the most food shops, followed by New York (2,645), Bronx (2,511), Westchester (1,155), and Rockland (335) for this group.
A few technical errors appeared in my mapping process (disambiguated below) that prevented most counties from appearing when visualizing it as a map. After some modification, the counties of Bronx, Queens, New York, Rockland, and Westchester yielded information that required no reconciliation from me (the user).
Obstacles:
Limited open access data – The choice to examine the quantity of food stores for the specific counties mentioned came after a difficult attempt to plot subscription data, first through magazines and later, music applications, which required specific manipulation of multiple datasets to visualize as a map. With the purpose of the assignment in mind, I became more interested in the technical aspects of mapping datasets and decided to broaden my topic in service to that and the process.
Privacy – The dataset I used aggregated addresses across counties, but absented identitarian information (race, gender, sexuality, etc.). My thought was to restart my search, specifying for demographic details in New York’s agricultural and market datasets. However, our class discussions on decoloniality and surveillance made me reconsider disambiguation to limit the scope of my map. It’s a minor intervention, as this project is limited to our class, but I hope to contemplate more ways to decolonize my methods (if this can be considered a step) as a practitioner.
Reconciling “unknown” items – I explored the “unknown” item(s) tab (bottom-right of screenshot), to which I later learned prevented me from mapping all counties featured in this set. Despite the accurate spelling of names, Tableau could not determine to map this information (e.g. Albany county was marked as “ambiguous”). I suspect an error may have occurred in my filtration methods in the ‘Data Source’ tab.
Conclusion:
Though I felt accomplished after trial and error, I felt limited by the availability of datasets (as it concerns my original topic), which is odd. The collection of big/small data is widely known, but retrieving and accessing databases for (clean) datasets, with proprietorship in mind, is a significant task that digital humanists and information professionals have to undertake in their methods.
If conditions were otherwise, I would have worked with library and department staff to better unpack my questions, and explore the possibilities of creating my own datasets to stretch the potential of my novice. Overall, I value this assignment and I think there’s utility in my map as a very (very) preliminary start on how to deploy open access data that can inform decisions on a move/relocation, assessing resources in an environment, etc.

This entry is licensed under a Creative Commons Attribution-NonCommercial-NoDerivatives 4.0 International license.