Author Archives: Asma (ahs-ma) Neblett

Workshop Entry on Inclusive Design

Earlier this semester, I attended ‘Inclusive Design and Accessible Exhibits, a presentation by Sina Bahram‘, which was a virtual webinar-workshop by data specialist, technologist, and entrepreneur, Sina Bahram. Bahram’s work appears in multimedia-accessibility discourses across North America, and was recognized on the federal level during the Obama administration for his contributions to accessibility and the STEM field. 

His webinar-workshop was an important highlight of my virtual semester as it focused on Bahram’s interpretation of Inclusive Design (ID), a methodology described (in this context) as a response to the limits of accessibility in technological design and multimedia services. To segue into his presentation on the preference of ID, Bahram provided commentary about the other commonly consulted Medical Model, which approaches accessibility from the standpoint of an individual’s disability and not the environmental factors that limit access for differently-abled individuals. 

Of the many items that were of value in his multi-step presentation on ID (giving control, appreciating context, and tolerance for error), the poetics of his Coyote Project – a partnership with the Museum of Contemporary Art (Chicago) and Prime Access Consulting – was extremely significant. The Coyote Project is concerned with increasing accessibility in the museum context through robust description software, which include audio aids. 

Bahram demoed the software for our audience – at the 42:45 mark of the presentation (viewable here) – using a stunning Kerry James Marshall painting. The Coyote Project collected cultural data across intersections of race, gender, and museum curation to produce a holistic and dimensional audio-description for differently-abled individuals. 

It was an opportunity to hear interdisciplinarity at work and placed into practice outside of a theoretical frame in a technological context. I immediately thought of bell hooks’ Oppositional Gaze and the extent to which the Coyote Project can be used as a case study for it as it concerns the reproduction and subversion of power through spectatorship informed by accessibility discourse. I could identify multiple gazes in the demo, which was sensorial in my experience and I’m curious about the ontological data that may emerge from similar approaches to ID in tech.

Bahram’s presentation was made possible by the Advocacy & Continuing Education sub-group of the DLF Digital Accessibility Working Group at CUNY. Bahram’s transcript is available upon request to this group. His presentation slides can be found here, via Dropbox.

“…using computation, and reframing the scale of literary inquiry, are two distinct things.”

Given all of the possibilities digital text creates for address (Witmore), I really appreciated the pieces from this week that trouble text analysis by questioning the over-reliance on computational methods to conduct it. 

By re-centering the physical book and its susceptibility, as it regards analysis, Witmore and the essence of the Underwood quotation for the title of this post inspired me to think about the conversation both readings provoke about the limitations of text analysis (as it stands) and why it matters to society at large.

When I think about the salience of distant reading and lemmatization (or categorizing text) as a means to digital text analysis, I am reminded not only of the analytical flaws that are probable in research reliant on it, but that the aggregated processing of information feels predetermined in our data-world. It is not enough to point out the cultural nuances lost in analysis, but that the surveillance and capitalist-driven attitudes toward a rapid, digitized world was widely accepted as an objective route to information and readership alike. 

I can recall very few public discourses that speak to the value of the manuscript such as the one that emerged when Amazon’s Kindle became popular in the late 2000s. While much of it spoke profit margins, modernity, and access (versus institutional research and DH), a handful of arguments advocated for the physicality of books and the analytical processes unique to it that computational analysis is missing.

In advocating for a better addressability in text analysis to yield the qualities associated with analyzing the manuscript, Witmore insists that a phenomenological shift would have to occur: 

“We need a phenomenology of these acts, one that would allow us to link quantitative work on a culture’s “built environment” of words to the kinesthetic and imaginative dimensions of life at a given moment.”

Much like Drucker (2014), there is a cultural address that should precede and become valued by non/DH-ers that concerns the way we analyze textual information as a society — past and present— and that begins with our foundational relationship to text.

Looking At Declining Water Consumption in New York City, 1980 – 2019

My Visual:

My visualization project concerns daily water consumption in New York City, collected from 1980 – 2019. Pulling from the New York City OpenData Project database, this “brief history” as described by the City, shows a mostly declining rate of daily water consumption within the last 18-19 years that leave much to infer about the reasons ‘why’.

I visualized this data using TableauPublic to examine the City’s water consumption dataset via Line Graph to probe for correlational informational as it concerns the year, annual City population total, and the consumption (million gallons per day).

Analyzing the Line Graphs, A – C

[Line Graph ‘A’]

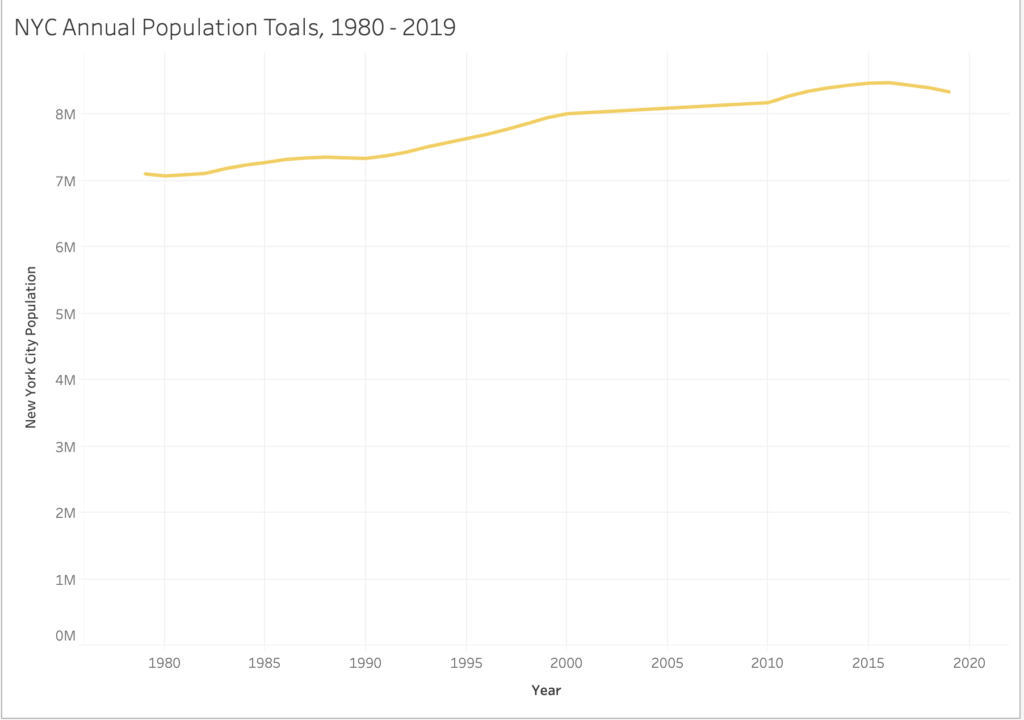
The first Line Graph, A, is a simple visual which demonstrates the annual population totals from the year 1980 – 2019 (though dates 1979 and 2020 are included to support the range). According to this graph, the general population in New York City has grown by over one million residents – and counting – between 1980 – 2019.

While what readily can be inferred is that the population total has gradually increased each year, what cannot be is whether or not this information captures all residents across citizenship (U.S., legal residency, etc.) for annual daily water consumption from 1980 -2019.

[Line Graph ‘B’]

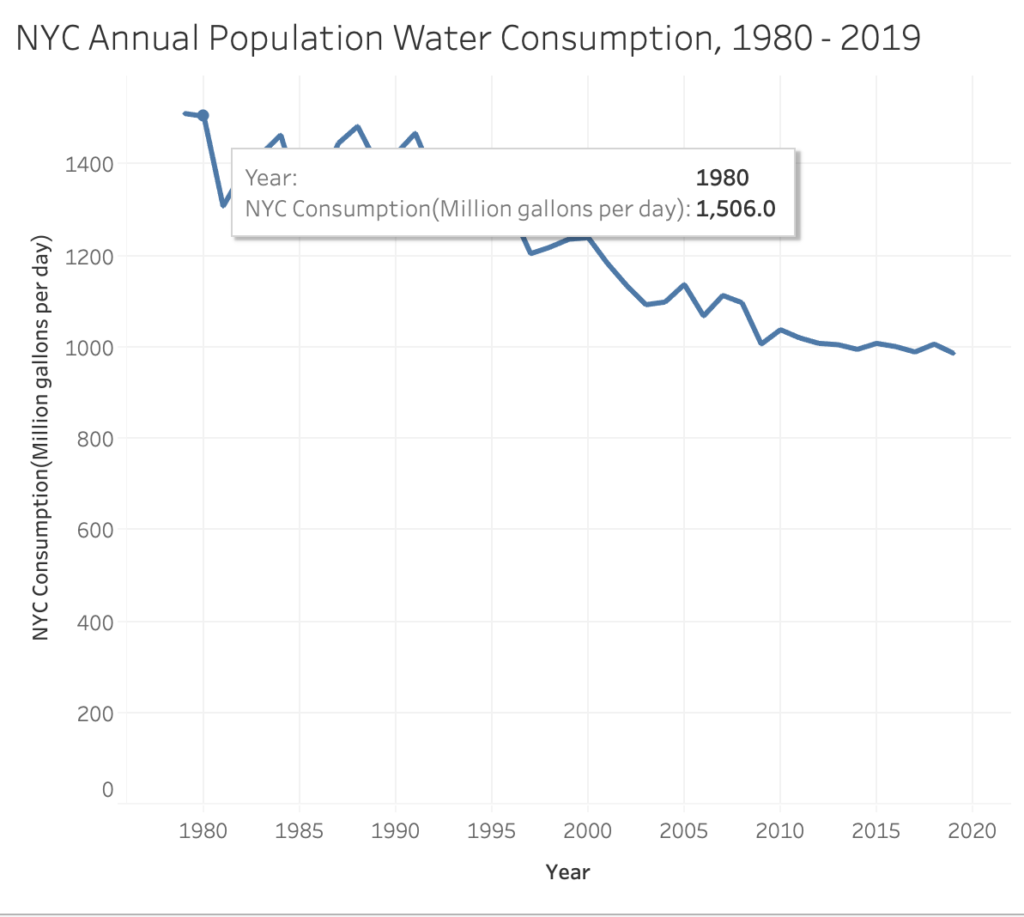
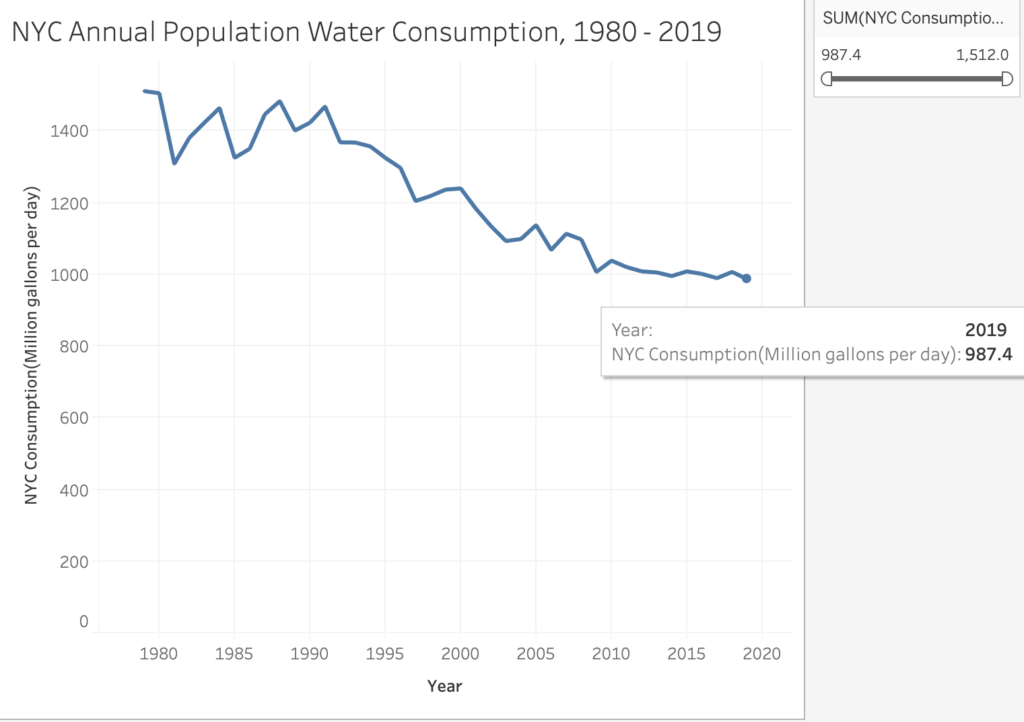
The second Line Graph, B, examined daily water consumption (million gallons per day) by the year. In 1980, 1.5 million gallons of water was consumed on a daily average, which had a population total of approximately 7 million residents in the City. But in 1985, the population total grew to approximately 7.2 million residents with water consumption declining to 1.3 million gallons of water on a daily average. 

The last noticeable peak for daily water consumption was the year 2000, which had a population total of 8 million residents and 1.2 million gallons of daily water consumption recorded.

[Line Graph ‘C’]

The final Line Graph, C, demonstrates significant data totals that point to a decline of daily water consumption by the year. Between 2000 and 2019, the highest peak for population and daily water consumption was the year 2000, with the lowest being 2019, which peaked at under 1 million gallons of daily water consumption recorded for 8.3 million residents in the City.

The most noticeable detail of Line Graph ‘C’ is the steady consumption of water between 2014 – 2019, which had similar population values (8 million residents) and daily water consumption totals that fluctuated between 900,000 – 1 million gallons on average.

Conclusion

In addition to census details mentioned earlier (‘who’ gets counted), overarching or guiding questions that feel most apparent are: 

  • why is daily water consumption declining as the annual population increases? 
  • And importantly: is this a bad thing?

A few answers can be found in the June 2016 Update, Water Demand Management Report, by the DeBlasio mayoral administration for New York City. According to the report, water managed by the City’s Department of Environmental Protection (DEP) was traditionally approached by increasing ”supply to meet demand.” However, the DEP focus have shifted to decrease consumption seen in the 1980s and 90s to conserve water and optimize “existing systems” through programming, incentives, and policy as the population increases.

The 2016 Update entailed six strategies:

  • Water Municipal Efficiency Program;
  • Residential Water Efficiency Program;
  • Non-Residential Water Efficiency Program;
  • Water Distribution System Optimization;
  • Water Supply Shortage Management;
  • and Wholesale Customers Demand Management.

While residential properties accounted for 78% of the City’s water consumption according to the year of the report, the greatest ripples seen at home can be traced to the Educational and Non-Residential “water saving” partnerships, which influence behavior and create incentives for daily water conservation at home.

A case-study for the report is “30th Annual Water Resources Art and Poetry Contest from January through May 2016.” The DEP recognized environmentally-conscious artwork, DEP Water Ambassadors, and over 1,600 submissions for the DEP Water Champions competition for City students. It can be inferred that students are not only generating concern about the importance of water in school, but that such attitudes adapted in their youth are likely to be brought home, and at best, normalized in their relationship to the environment.

In summary, water consumption feels like the most logical response to what science tells us about global warming, especially in multi-cultural municipalities such as New York City, which was not my original thought when contemplating the dataset. 

Beyond the presumable good that is associated with conserving water, I am interested in the behavioral and ontological outcomes this may produce as it concerns humans’ relationship to the earth, and how optimizing the environment through human-measures, seen in the report, can be impact human-self and human-human relationships as it concerns care and compassion.

Visualizing the Quantity of Retail Food Stores Across Five NY Counties

My Map:

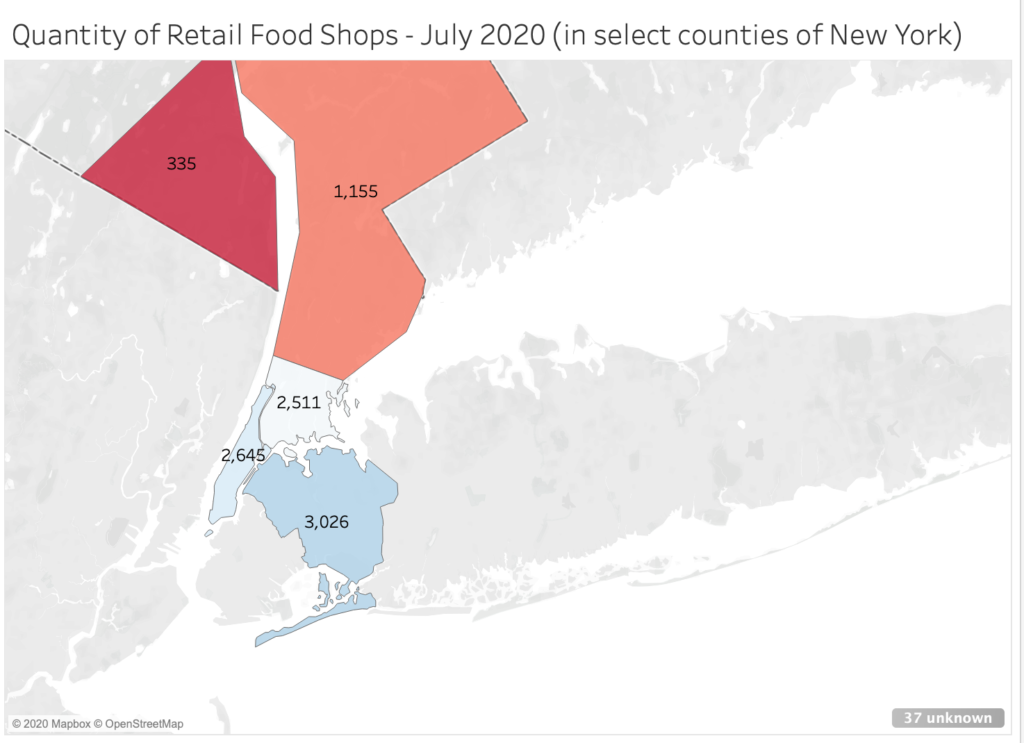
My map visualizes the quantity of retail food stores across select counties of New York (Bronx, Queens, New York, Rockland, and Westchester) using Tableau’s 14-day free-trial of the software. 

I decided to explore NYC’s 2020 Open Data projects database (via its website and GitHub) in the area of agriculture and markets due to the reliability of this information. Open access food-data, so to speak, is already regulated through The New York State Department of Agriculture and Markets (when pulling from Open Data), and the literature on the topic in the region is sizable, given the role of environment on food sources in the City. The reliability, presence of detailed information, and integrity of Open Data made mapping this topic viable for the purpose of the assignment.

What my map shows:

My map visualizes the quantity of food shops across five counties, which include supermarkets and small shoppes (delis) that can be indexed in the City and Department of Agriculture and Markets’ databases as of July 2020

I used a gradient to scale results: 

  • blue to cerulean: a high quantity of food shops;
  • white, orange, and light-red: moderate quantity of food shops;
  • red to crimson: lower quantity of food shops.

Queens (3,026) ranked first in this set for the most food shops, followed by New York (2,645), Bronx (2,511), Westchester (1,155), and Rockland (335) for this group.

A few technical errors appeared in my mapping process (disambiguated below) that prevented most counties from appearing when visualizing it as a map. After some modification, the counties of Bronx, Queens, New York, Rockland, and Westchester yielded information that required no reconciliation from me (the user).

Obstacles:

Limited open access data – The choice to examine the quantity of food stores for the specific counties mentioned came after a difficult attempt to plot subscription data, first through magazines and later, music applications, which required specific manipulation of multiple datasets to visualize as a map. With the purpose of the assignment in mind, I became more interested in the technical aspects of mapping datasets and decided to broaden my topic in service to that and the process.

Privacy – The dataset I used aggregated addresses across counties, but absented identitarian information (race, gender, sexuality, etc.). My thought was to restart my search, specifying for demographic details in New York’s agricultural and market datasets. However, our class discussions on decoloniality and surveillance made me reconsider disambiguation to limit the scope of my map. It’s a minor intervention, as this project is limited to our class, but I hope to contemplate more ways to decolonize my methods (if this can be considered a step) as a practitioner. 

Reconciling “unknown” items – I explored the “unknown” item(s) tab (bottom-right of screenshot), to which I later learned prevented me from mapping all counties featured in this set. Despite the accurate spelling of names, Tableau could not determine to map this information (e.g. Albany county was marked as “ambiguous”). I suspect an error may have occurred in my filtration methods in the ‘Data Source’ tab.

Conclusion:

Though I felt accomplished after trial and error, I felt limited by the availability of datasets (as it concerns my original topic), which is odd. The collection of big/small data is widely known, but retrieving and accessing databases for (clean) datasets, with proprietorship in mind, is a significant task that digital humanists and information professionals have to undertake in their methods. 

If conditions were otherwise, I would have worked with library and department staff to better unpack my questions, and explore the possibilities of creating my own datasets to stretch the potential of my novice. Overall, I value this assignment and I think there’s utility in my map as a very (very) preliminary start on how to deploy open access data that can inform decisions on a move/relocation, assessing resources in an environment, etc.

Big Data and Breonna Taylor

My focus for this week’s blog is Cottom’s arguments about the political-economic and cultural implication of big data. I planned to center this in relation to my observation of the NYC public charter school system’s questionable deployment of data to govern educational decisions for vulnerable k-12 children.

However, in light of the Class-D felony indictment of one of three officers involved in the killing of Breonna Taylor (at the time of this entry), I feel Cottom’s argument is even more pronounced as we look at the role of big data in the case of Taylor.

For those unfamiliar, Breonna Taylor was a former EMT, lover of life, and constituent of Louisville, Kentucky killed in her home during a violent police raid.

Much like the 2015 death of Sandra Bland in police custody, the optics of Taylor’s death was rapidly reduced to a social media trend from desperately monetizable media accounts and private companies who saturated our pandemic-economy with seed grants in attempt to profit from her death and protests. The digital consumption of her death gave returns along the lines of clout, rebranding, and likely unreported income for certain companies and personalities that attach her likeliness to their digital profiles in a time of quarantine.

The largely hurtful trends I’ve seen include microscopic texts on random body-parts and objects, that when enlarged reiterate the fact she is dead, or playfully call for the ‘arrest’ of the officers involved. Other examples include clickbait captions and threads on Twitter, inappropriately copied from fandom accounts (‘stans’) who originally leveraged it to visibilize Taylor and dozens of related petitions across the country in the vain of justice. The popular application, Tik Tok, was also a hub for what can be perceived as deleterious to her case and mourning. 

But among the most disturbing include the seemingly unauthorized use of Taylor’s image to make murals and BLM merchandise that yet again, generate profit, and subtract from a path toward healing and the state naming its agent (and itself) as the transgressor. This is especially symbolic in an instance where a Black woman is the deceased in a potential case against the state (of Kentucky).

Around the same time of Bland’s death, a critical hashtag, #SayHerName, emerged across social media, inspired from philosopher and legal Black feminist , Dr. Kimberlé Crenshaw’s Say Her Name campaign. It highlights the cases and nominal information that substantiate how Black women, girls, and femmes have and currently experience violence and fatality at alarming rates, in and from the state. It also unpacks how their stories become ambiguated in justice work with the priority on cismale counterparts by media.

As I consider this, and Cottom’s discussion on the de-prioritization of power-relations in the push for big data (and how that depreciates analysis), I see how terrifyingly connected it is to the indictment and treatment of Taylor’s life — and death — from the inception. Even in passing, Taylor is not appreciated as a person, but instead consumed as a unit of information for power and profit.

Rest in peace to Breonna Taylor, her life and legacy are not #trends.

Re-contemplating Geography as it Governs the Assemblage and Nomenclature of ‘Black’ through Gallon and Josephs

  • I want to briefly (lol) examine geography as a link between Gallon and Josephs’ approaches to ‘Black’, diasporically, and how it governs the deployment of ‘Black’ and the application of it in Black DH (BDH).
  • Across the many BDH projects included in Gallon’s essay (Graham’s Project on The History of Black Writing, Digital Schomburg) the offerings in BDH are rich, and yet deeply rooted in the West and recovery and epistemologies made there  — which may be slightly antithetical to ‘Black’ as encompassing or universal, and what BDH seeks to accomplish as an application, without a closer examination of the term (to which Gallon begins to unpack in the beginning of her chapter).
  • We see this particular struggle intimated in Josephs’ offerings on her 2010s coursework; it is precisely compounded by the way geography moderates or governs ‘Black’ when contemplating the intersection of Digital and Caribbean, and how methods of DH can be used to emphasize (or contemplate) cultures that (should) assemble ‘Black’ and the DH field as a whole. I wished for greater detail on how the six out of eight Caribbean students (for the course) deployed DH with this in mind.
  • Despite the nomenclature of ‘Black’ and how ‘Caribbean’ intimately disrupts barrier (as a culturally diffusive ethnicity, not traditionally considered ‘West’ despite region) the dearth of information on the intersection of DH and the Caribbean encourages us to consider how BDH can (and must) look after this category as we consider the deployment and assemblage of ‘Black’ in the field.
  • When I contemplate BDH as an assemblage and in fact, “a progenitor and host,” per Gallon in Digital Humanities — specifically on the concept of humanity — Josephs’ struggle helps me to tangentially infer on how the geographical power structure of the West currently situates and governs BDH epistemologies determined to do the opposite in its purposeful “dismembering” of the DH field.
  • In looking at both, I yearn for more assemblages that look like Josephs’ work, and that move the dialectic of Gallon into categories that re-contemplate nomenclature – beyond whiteness as a next step – with greater consideration to geography, especially as a primary way to contemplate what assembles or constitutes ‘Black’, in (and outside of) DH.

Centering an understanding of DH through The Early Caribbean Digital Archive.

One of the features that make The Early Caribbean Digital Archive a special place to center DH are the implicit questions it asks of us as it concerns access, power, and our relationship to both, that DH enables. I think these provocations are urgent, especially as it concerns Spiro’s argument about DH’s identity and the current pressures placed upon this dilemma as Western dependence on the field increases during a time of pandemic, continued state violence, natural disaster, and an election season. 

To frame, The Early Caribbean Digital Archive is described as a decolonial project and archive, and its mission is to make “pre-twentieth-century Caribbean archival materials” available for research, public access, and contributions to the field. Objectively, it serves as a powerful, politically-transparent, and institutionally-verified site of critical, curated and reliable historical information signature to DH. 

However, interpretatively, its presence and collection processes (for the good it accomplishes) open conversations on authority, privacy, and the right to excavate and digitize information in DH. 

We understand the political imperative that undergirds The Early Caribbean Digital Archive. But as visitors interact with historical material, and the prompts on how a majority of it is still scattered and inaccessible to the constituencies from which they belong, it should provoke questions on the extent of access, and the almost exclusive-like authorization of digital material for and by Digital Humanists.

To clarify, I think this is what The Early Caribbean Digital Archive *provokes* as we appreciate the historical context surrounding this specific Archive, and as we interpret DH as a field with a particular commitment to the public. 

What does it mean for DH scholars and institutions – and not a constituency or its’ people – to have authority over material and the availability of it?’ is a longwinded question that I carry about my topics and the utility of DH.

Specifically, I believe a true meditation on access, authority/power, and privacy can extend the existing discourse on ethics, and the development of guidelines that allow us to mitigate authorial (and potentially exploitative) practices that shape the way information is managed, deployed, and by virtue, the field’s identity.