
My Visual:
My visualization project concerns daily water consumption in New York City, collected from 1980 – 2019. Pulling from the New York City OpenData Project database, this “brief history” as described by the City, shows a mostly declining rate of daily water consumption within the last 18-19 years that leave much to infer about the reasons ‘why’.
I visualized this data using TableauPublic to examine the City’s water consumption dataset via Line Graph to probe for correlational informational as it concerns the year, annual City population total, and the consumption (million gallons per day).
Analyzing the Line Graphs, A – C
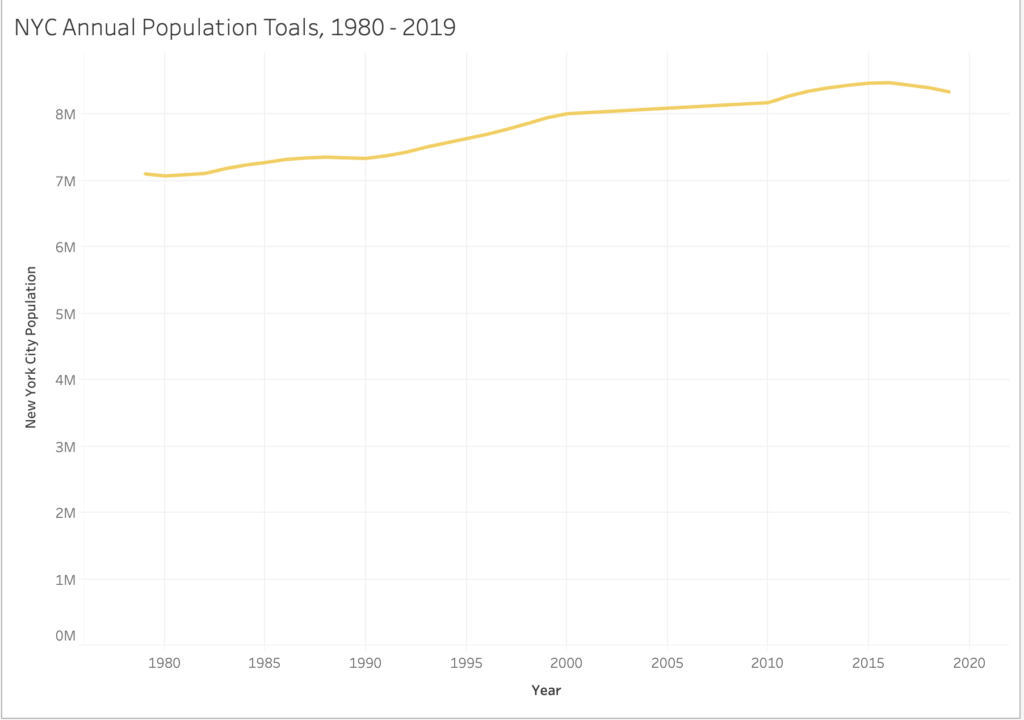
[Line Graph ‘A’]
The first Line Graph, A, is a simple visual which demonstrates the annual population totals from the year 1980 – 2019 (though dates 1979 and 2020 are included to support the range). According to this graph, the general population in New York City has grown by over one million residents – and counting – between 1980 – 2019.
While what readily can be inferred is that the population total has gradually increased each year, what cannot be is whether or not this information captures all residents across citizenship (U.S., legal residency, etc.) for annual daily water consumption from 1980 -2019.
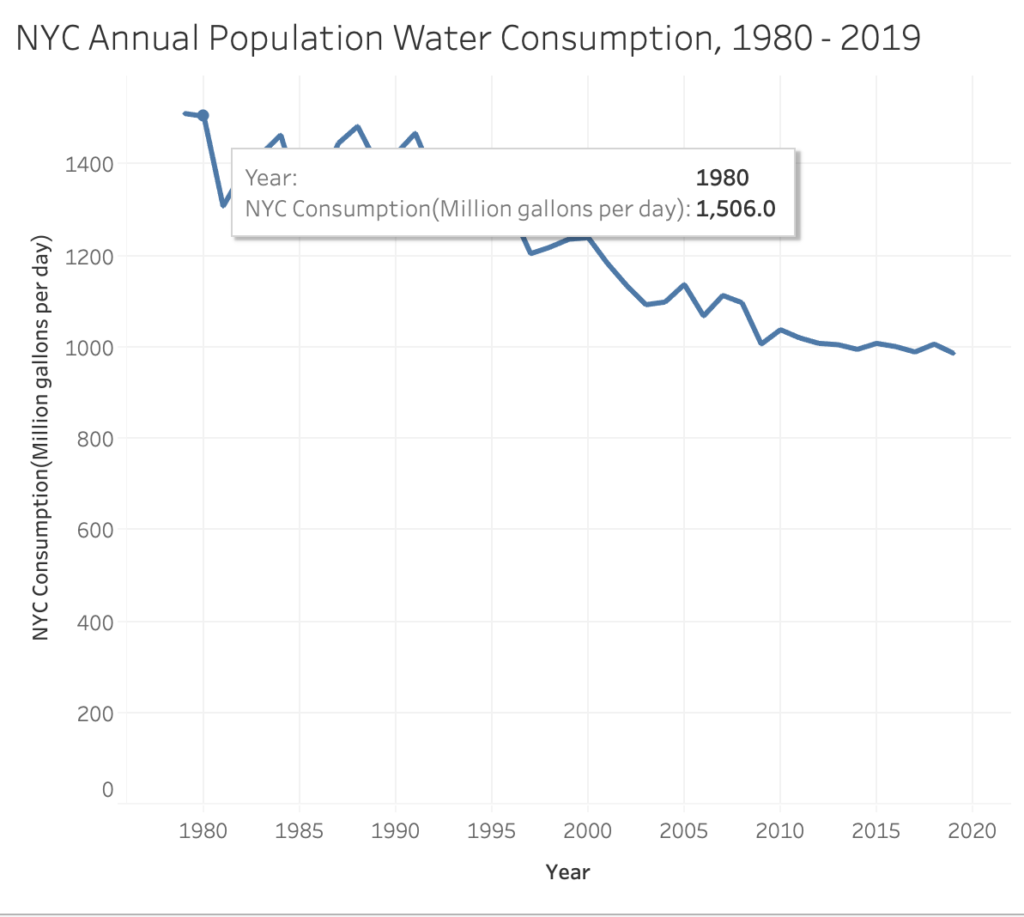
[Line Graph ‘B’]
The second Line Graph, B, examined daily water consumption (million gallons per day) by the year. In 1980, 1.5 million gallons of water was consumed on a daily average, which had a population total of approximately 7 million residents in the City. But in 1985, the population total grew to approximately 7.2 million residents with water consumption declining to 1.3 million gallons of water on a daily average.
The last noticeable peak for daily water consumption was the year 2000, which had a population total of 8 million residents and 1.2 million gallons of daily water consumption recorded.
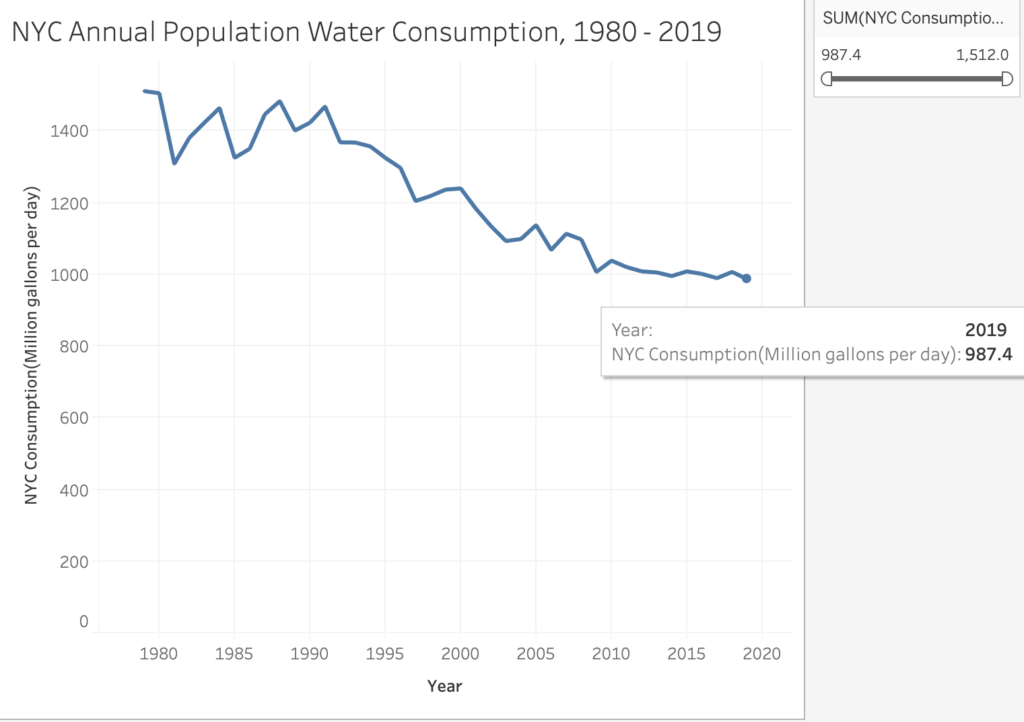
[Line Graph ‘C’]
The final Line Graph, C, demonstrates significant data totals that point to a decline of daily water consumption by the year. Between 2000 and 2019, the highest peak for population and daily water consumption was the year 2000, with the lowest being 2019, which peaked at under 1 million gallons of daily water consumption recorded for 8.3 million residents in the City.
The most noticeable detail of Line Graph ‘C’ is the steady consumption of water between 2014 – 2019, which had similar population values (8 million residents) and daily water consumption totals that fluctuated between 900,000 – 1 million gallons on average.
Conclusion
In addition to census details mentioned earlier (‘who’ gets counted), overarching or guiding questions that feel most apparent are:
- why is daily water consumption declining as the annual population increases?
- And importantly: is this a bad thing?
A few answers can be found in the June 2016 Update, Water Demand Management Report, by the DeBlasio mayoral administration for New York City. According to the report, water managed by the City’s Department of Environmental Protection (DEP) was traditionally approached by increasing ”supply to meet demand.” However, the DEP focus have shifted to decrease consumption seen in the 1980s and 90s to conserve water and optimize “existing systems” through programming, incentives, and policy as the population increases.
The 2016 Update entailed six strategies:
- Water Municipal Efficiency Program;
- Residential Water Efficiency Program;
- Non-Residential Water Efficiency Program;
- Water Distribution System Optimization;
- Water Supply Shortage Management;
- and Wholesale Customers Demand Management.
While residential properties accounted for 78% of the City’s water consumption according to the year of the report, the greatest ripples seen at home can be traced to the Educational and Non-Residential “water saving” partnerships, which influence behavior and create incentives for daily water conservation at home.
A case-study for the report is “30th Annual Water Resources Art and Poetry Contest from January through May 2016.” The DEP recognized environmentally-conscious artwork, DEP Water Ambassadors, and over 1,600 submissions for the DEP Water Champions competition for City students. It can be inferred that students are not only generating concern about the importance of water in school, but that such attitudes adapted in their youth are likely to be brought home, and at best, normalized in their relationship to the environment.
In summary, water consumption feels like the most logical response to what science tells us about global warming, especially in multi-cultural municipalities such as New York City, which was not my original thought when contemplating the dataset.
Beyond the presumable good that is associated with conserving water, I am interested in the behavioral and ontological outcomes this may produce as it concerns humans’ relationship to the earth, and how optimizing the environment through human-measures, seen in the report, can be impact human-self and human-human relationships as it concerns care and compassion.

This entry is licensed under a Creative Commons Attribution-NonCommercial-NoDerivatives 4.0 International license.