One of the things I love the most about New York City is its diversity, which translates to the incredible variety of restaurants that we’re lucky to have at our disposal. I remember trying Vietnamese, Korean, and Ethiopian food for the first time in the city…Italy has great food, but not a lot of diversity!
I decided to use the dataset for the DOHMH New York City Restaurant Inspection Results, which I had downloaded in Spring 2020 for my Geospatial Humanities class. [1] I was hoping to make a map out of it, but I realized it was a little complicated with ArcGIS on my slow PC…however, this dataset worked very well for Data Visualization!
I was inspired by the work my classmates did for their Mapping assignment and decided to use Tableau for my data visualization. Thanks to a handy tutorial on the Tableau website, I was able to select the dimensions and measures I wanted to portray and explore different styles of visualization. I spent a morning just exploring the data on Tableau and trying to combine different fields to see if anything interesting came out. I experimented with Restaurant Grades and Scores, but then I decided to keep it simple and calculate the top 10 Cuisines for each borough. New Yorkers intuitively know that the best Chinese food is in Chinatown (Manhattan), Flushing (Queens), and Sunset Park (Brookyln). Or that you can find handmade mozzarella in Little Italy (the Bronx one!). And that there is a big Orthodox Jewish Community in South Williamsburg, so that’s the place to go if you are craving bagels, smoked fish, and chocolate babka. I wanted to see if the data reflected this empirical evidence.
I opted for a very simple bar chart showing the Top 10 Cuisines in each borough, which you can find here. I used a tutorial I found on Youtube to display the number of top cuisines for each borough, calculated as a percentage of the total. I decided to differentiate the cuisines by color for easy reference, but also for the aesthetical reason to portray the mosaic of NYC cuisines in my visualization.
As we can see from the visualization, American cuisine is the most prominent in each borough, with a spike in Manhattan. Chinese restaurants are the second most popular establishments in all boroughs except Staten Island, where they predictably get beaten by Italian restaurants. Italian food appears in the top 10 of Manhattan and Staten Island, but surprisingly not in the Bronx – where there is, however, a 7.7% rate for “Pizza” and a 2.7% rate for “Pizza/Italian”. Jewish/Kosher restaurants appear in the top 10 only in Brooklyn, which reflects my initial assumption. A thing I found interesting is that, despite there being a Koreatown in Manhattan, Korean cuisine makes it to the top 10 only in Queens.
In the end, this project left me with more questions than answers.
- According to the metadata of the DOHMH New York City Restaurant Inspection Results (the “Data Dictionary” spreadsheet), the “Cuisine Description” field is an “Optional field provided by provided by restaurant owner/manager”. The fact that there is a discreet number of categories makes me think that the owner/manager of a restaurant needs to choose from a list, which means that diversity is necessarily reduced. How do you classify the amazing Chino-Latino cuisine?
- What does “American Cuisine” mean? When I saw that field, I immediately assumed it meant burgers, BBQ joints, and steakhouses, but this is just my imagination (and my bias) filling the gap in the data. Soul food is definitely American, but it doesn’t fit neatly in the definition. I would love if there was an ulterior classification for American cuisine, or at least a more extensive description in the metadata.
- In the future, I would like to investigate the correlation of predominant cuisine and demographics in a ZIP code: for example, Manhattan’s Little Italy has a lot of touristy Italian restaurants, but I doubt that there are many Italians or Italian Americans living in the neighborhood. I’m looking forward to the release of the 2020 Census Data for this.
- How many restaurants have closed due to the Coronavirus crisis? Which cuisine was the most affected? I would need to interrogate the datasets for Spring 2020 and October 2020 to have a comparison.
I would greatly appreciate hearing your feedback on this project and how you would improve it. Stay safe and support your local restaurants!
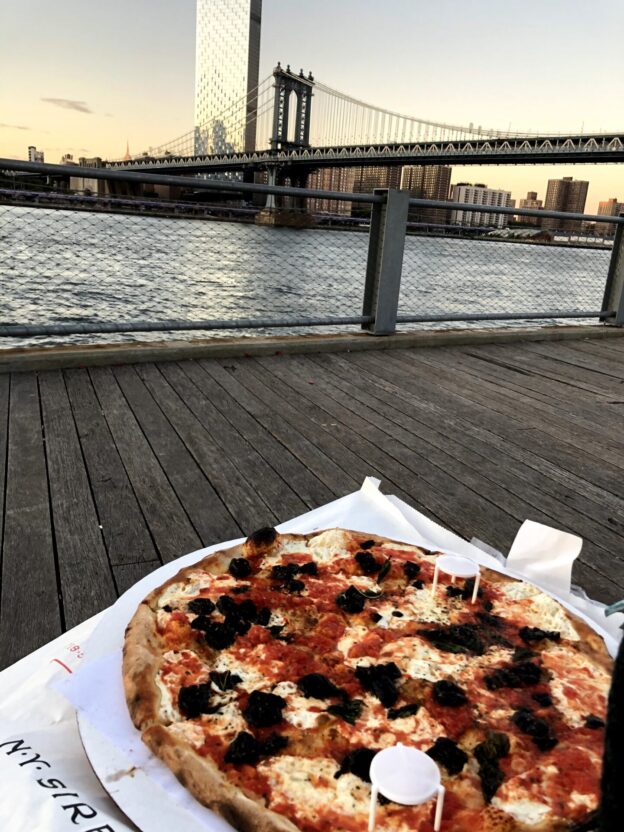
P.S. The huge pizza in the image is from Juliana’s Pizza in Dumbo, Brooklyn and I highly recommend it!
[1] I’m mentioning the download timeframe because the data gets updated according to new inspections from the Department of Health. Here I’m presenting the data as it appeared in Spring 2020: this means that the dataset probably portrays restaurants that are now closed and doesn’t have data on new restaurants that might have opened since then.


