Author Archives: Rachel Dixon

A Terrifying Tale of Two Vampire Text Analyses

Last month I took a seasonal dive into vampire folklore and its appearance in literature, film, and video games, thinking about the vampire archetype as it correlates to power, illness/medicine, and of course, im/mortality. (“Seasonal” in this case meaning both Halloween and political season.) As a result of having vampires on the brain, I did a quick analysis of the different spelling variations of the word vampire that I was familiar with appear in English literature: vampyr, vampyre, and vampire, to see the trends in Google’s Ngram tool. I didn’t assume that I would have such meaningful results.

Google Ngram for Vampyr

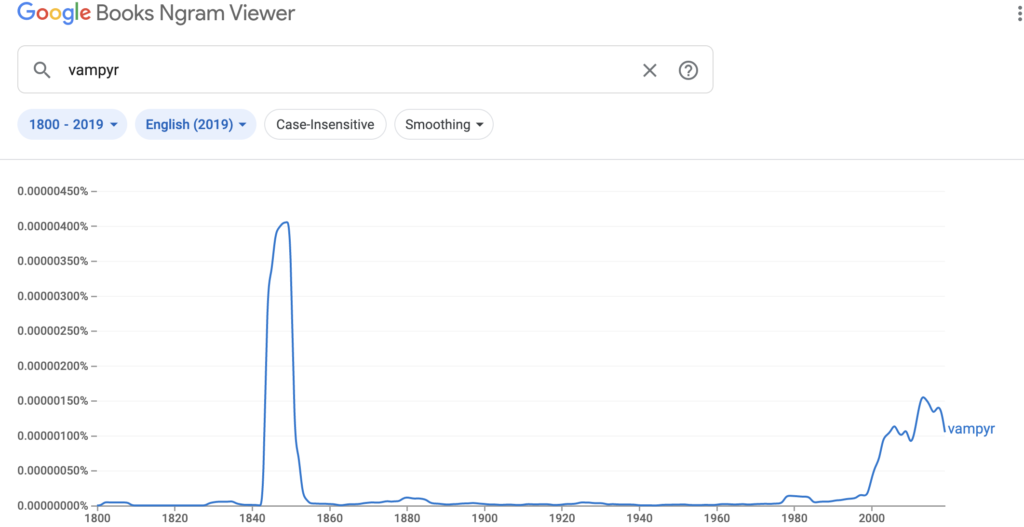
“Vampyr” alone has a clear bump in published words beginning in the late 1830s which correlates to literature about the opera Der Vampyr, and sometimes to its source material, a stage play with Der Vampyr in the title as well from a similar period. It also increases in popularity as the overall trend in vampire content increases in the late 20th century, though after reading a bit about Der Vampyr, I wonder if there’s a correlation with this spelling, and a BBC miniseries based on the opera in the 90s. Google’s tools largely return novels with “Vampyr” in their title as the source of the trend, but if I were researching the term further I’d want to know if the authors had seen the miniseries and if that influenced their stylistic spelling choice.

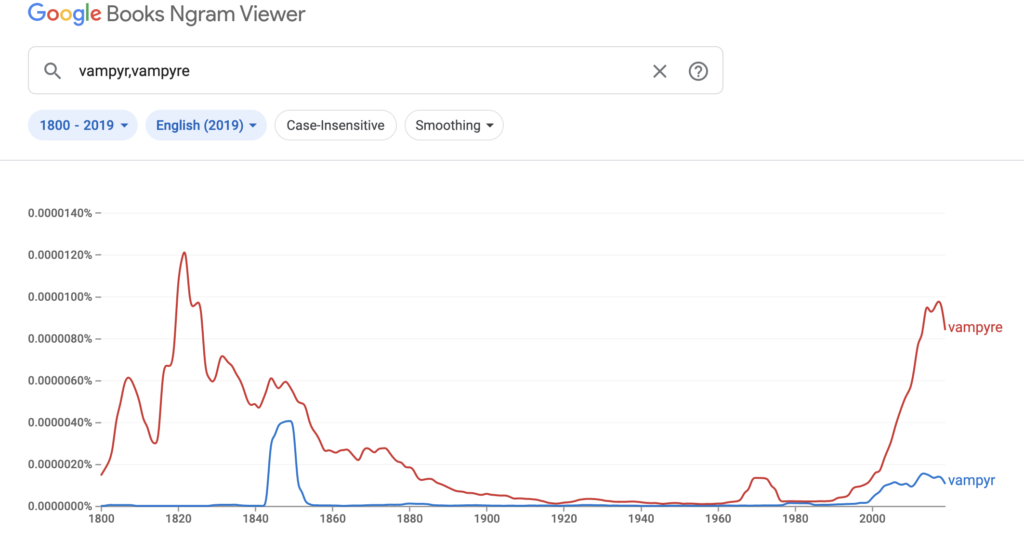
The Ngram for “Vampyre” was the richest graph I pulled as the first bump in the timeline correlates with the short story by John Polidori, The Vampyre: A Tale, published in 1819. While I was familiar with the name, I was not aware of its place in (forgive me) the vampire chronicle: Wikipedia’s entry on this revealed that not only is this considered to be (Along with Bram Stoker’s Dracula, later in the century) one of the first of the vampire stories as we know them today, but that it was also the source of the source material for Der Vampyr, the opera of the previous Ngram. More trivia: Polidori’s Vampyre was the “winner” in a contest between Percy Bysshe Shelley, Mary Shelley, Polidori, and Lord Byron (who was credited with writing The Vampyre due to an attribution error for a while). Another famous work submitted to this contest was Frankenstein! Also of note from further Wikipedia diving: Byron references vampires in at least one of his poems from the 1810s as well and to be the inspiration for Polidori’s Vampyre himself, Lord Ruthven!! The literary tea from this exercise!

Google Books Ngram for "Vampire"

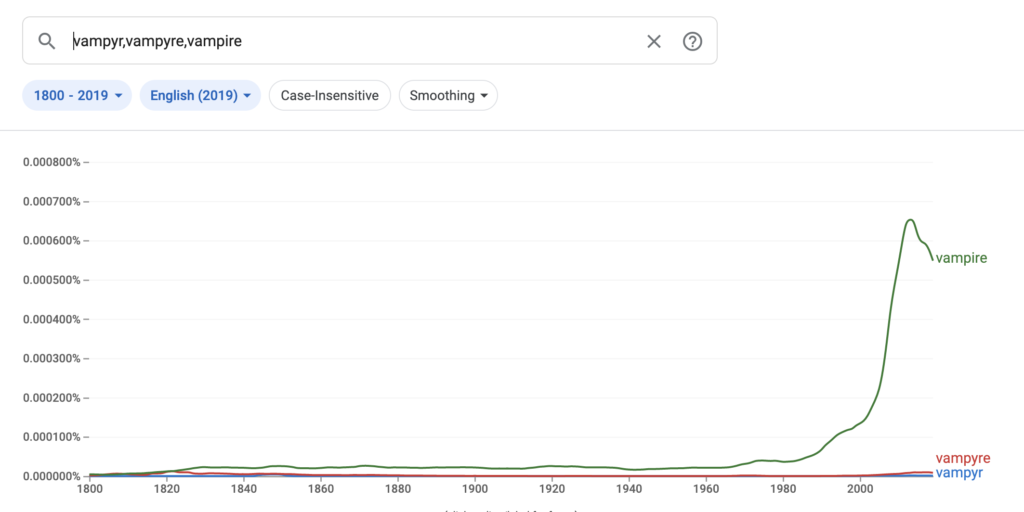
“Vampire” on the other hand, has a clear upward trending line that correlates with my understanding of the romantic vampire trope’s ascendance, and when compared, the standard modern English spelling eclipses the other two starting in the 80s. Without any further research I wonder if this correlates with the publication of Anne Rice’s series and also with the rise of another pandemic, or both. Unfortunately I wasn’t able to figure out how to hone into that specific decade, though in the search results Google gave me in the time range chosen by the tool, Rice was the most prevalent author. Many of the other books were anthologies, signifying enough content created by then to do so.

Bram Stoker’s Dracula is another small bump in the early 20th century, which inspired me to do a quick Voyant comparison between the Dracula text and the Vampyr text, as both are available to the public. This leads me to my second terrifying text analysis, via word clouds.

Dracula Word Cloud
The Vampyr word cloud

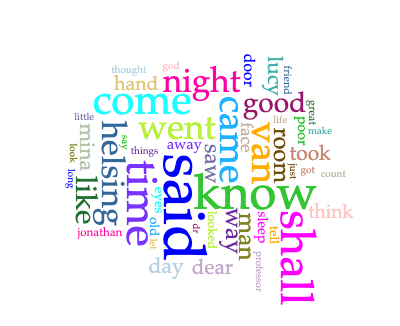
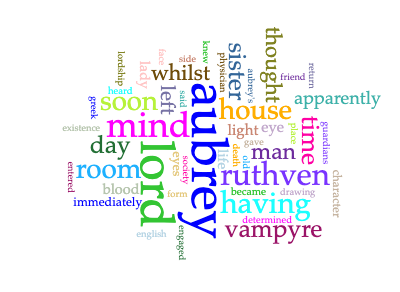
There were not many surprises except for one: how infrequently the word “blood” appears, since one assumes hematophagy is one of the defining characteristics of the archetype, in the way that it is one of the defining characteristics of a mosquito. Given that my exposure to the vampire archetype is firmly rooted in the 20/21st century, my bias on this characteristic may be overly influenced by my exposure to the vampire of film and television, where themes of the same genre may be weighted differently due to the way the reader/viewer perceives them. All speculative, because the text analysis tools alone cannot give me direct insight into film and television trends, but directionally it is an interesting question to ask.

I was surprised to find that text analysis, using the simplest tools I found, created such a rich study of a subject by simply inquiring. I initially had overwhelmed myself with the concept of text analysis, but I was relieved to find that with a bit of tinkering, the tools invoked a natural sense of curiosity and play, leading to further analysis. (Apologies to all for my tardiness as a result!) As an unintended result of this project, I am inspired to read both of these 19th century works of the early romantic vampire canon.

RHONY vacation location map example with pop up

Mapping The Real Housewives of New York Vacation Locations

For our mapping assignment I created a map of the major vacation locations during the 12 seasons of the Bravo reality television series The Real Housewives of New York.

What Is This?
One of the main tropes of the series that acts as a narrative arc for the film editors who have to cobble together a narrative from hours of footage on such television shows has been to send the cast away from the location that the franchise is usually located in. This contrivance provided an interesting dataset to play with while I learned more about mapping tools.

What It Isn’t and Why
This was my third attempt at a mapping assignment. This is not my original dataset of misdemeanor drug incarcerations by state overlayed with states that recently legalized marijuana and by which degree. That data is available and was easy(ish) to clean but I kept hitting a wall in thinking about how to display the data. This is an issue I feel very passionate about but as with many issues right now it was exhausting to consider. Frankly I know the wall I ran into was abject despair. So, I scrapped it.

Instead, over the past weekend I started to work on something with a much smaller scope, as I have many looking at available open data regarding entertainment, another passion. I began to work with a map that completed the bare minimum requirements of “making a map” of the theater institutions in Times Square, but I could see how that didn’t offer me an opportunity to discover new information as much as I had hoped. However, when someone asked me if I would be watching the presidential debates I answered “I will be doing whatever the opposite of that is.” This is what I thought at the time would be the most oppositional feeling project and it frankly lifted me from said despair.

Some Decisions & Tools
I had to collect and clean a lot of this data from the web as it does not exist in one place. I used fan culture, blogs, and imdb to cross reference, as well as Google Maps search for location data. I added this information to a Google sheet which I connected to then geocode in Carto.

For the dataset, I did not include trips with the following criteria: in-state trips (upstate/Catskills/Hamptons), visits with fewer than 2/3 of the cast, or work trips that were not obvious parts of this narrative story lines.

I considered the “total number of episodes in the season” to be the number of filmed and edited “reality” episodes, and not the number of meta/reunion/seated episodes (the episodes about the episodes), as a trip would not be possible or likely. To consider the potent reunion episodes as well would require a different analysis, and is unlikely to be useful in this case. Another time.

Surprises
I didn’t think I set out to learn anything about the data but I was wrong. It was interesting to me that the trips are generally set at the end of the season with a two or three episode arc, which conclude in the penultimate episode (a la the Red Wedding in Game of Thrones). This became more interesting as the seasons went on when there were interruptions to this pattern. For example, in 2016, a dramatic season ends during a vacation trip (dénouement from the suitcase). In the most recent season, there is a double arc, with a small trip to Newport at the beginning of the season, and a longer trip to Tulum at the end of the season. Was this due to the change in production from home in 2020? Is this season two seasons? How much vacation footage is always left on the cutting room floor in non-pandemic years? I was surprised that the more I dug into the map, the more questions I had about nonlinear narrative structures. I was unsurprised that this project reinforced my utmost respect for film, sound, and television editors.

Disappointments
None of this data exists anywhere in one place as I mentioned. In 12 seasons and multiple locations, many of the hotels have switched ownership as well. Some of the properties were private rentals, and as such I had to guess at their general area based on their proximity to landmarks. I of course wished I had more time to create deeper data with information about the hotels or more details about the episodes/seasons.

Visually Comparing Difficult Histories

I kept going back to the Two Plantations project this weekend, thinking I was missing a larger abstract that would answer the many growing questions I had each time I interacted with it— questions about the project itself, its methods of visualization, its authors, and its intent. In my most generous interpretation I concluded that my main reason for coming back to this project was that I was not given enough context about the process, its original goals and how it met them or where it met its failures. In previous projects we’ve examined such as the Caribbean Digital Archive or the Colored Conventions Project, I was able to interpret a bit more about the results given the analysis of the methods, intent, team, and the process used, but the Two Plantations project offered very little on the site beyond an introductory paragraph or two.

We have discussed that Digital Humanities projects can reveal more during the process of synthesis rather than at the conclusion, and in this sense I was ultimately frustrated with the site and the visualization qua visualization. I believe the narrative and information that could have been given to me with a more robust datavis design is likely lost to the book about the larger project (link in the biography of the Principal Investigator, Richard Dunn). In speaking about what visual data is and isn’t, what does it say about the website itself (not the interactive family tree visualization and its choices) that the one full color high resolution picture of a person is of the scholar themselves, and that the names of the subjects are limited to abstract squares and circles on a screen (or in a different artifact, the database of names/pivot table)? I was unfortunately too distracted by this question, as well as the question that seemed obvious and mean to me: did Dunn ask why the racialized names were so different on each plantation, if his data about these names were correct, and either way if also it were correct to expose his audience to it without context? (Should I just read the book?)

When reading Jessica Marie Johnson’s review of the Two Plantations project and her opinion that the site was as “gorgeous” I resisted, but I now interpret this to be in line with my analysis as well: the high gloss presentation of the design of the website can be distracting from the design of the content itself. As Johnson points out, was a family tree the best visualization for this analysis? It does serve to illustrate the short lifespan and difficult “family ties,” but does this represent the overarching statement that “both plantations suffered?”

More questions: Is bloodline archival research inherently colonist and is that OK for this project? What is meant when Dunn says “did interracial sex affect the meaning of relationships” during the 1800s here, and is this a “thorny question” or wildly inaccurate? Benign in comparison, is this type of representation the best format with which to compare two data sets of any kind? I found it distracting to flip back and forth between the two tabs (even with more Dixons in the Mount Airy data!).

At some point either reading about this or “Difficult Heritage and the Complexities of Indigenous Data” I was reminded of W.E.B. Du Bois’s Data Visualizations, which I recently became aware of. Some of these visualizations are so original in their representations that I also like asking “Is this the best way to show this data?” frequently when viewing them, but unlike Two Plantations it is clear to me that this question had been carefully considered, even in the most experimental or even unsuccessful images. In considering data visualizations as a whole this week, I am considering how similarly to maps, they often must tread the line between 1:1 representation and and an abstraction that communicates implicit information.

Definition by Failure, Definition by Values

As others have mentioned, one of the values that is paramount to the field is its ability not only to experiment but to do so freely, meaning that failure is not only safe, but considered valuable, as it creates “new ignorances” that may not have otherwise been found. It is possible that the act of defining the digital humanities is an experimental process that will continue to recreate itself and uncover imprecisions and new ignorances in ways that other fields that are less experimentation, tool, and values-driven are not.

A thread that ran through the assigned texts was an effort to define Digital Humanities with examples like the “big tent” metaphor, or as an expanding field likened to sculpture. It is possible that DH resists definition because it is in a constant state of revision/remix/refactoring (choose your tool) but that also makes these attempts to do so very lively. The attempts to define DH are like experiments themselves, and if they lack precision or do not meet the requirements of their test, they have discovered “new ignorances,” which allow the scope of the field to grow and refine itself. This itself appears a defining feature of DH and is one of the most exciting parts to me, the exploratory and revolutionary reflection on itself and ability to reinvest in a better, more

I have to ask because it is a thing I have been trained to do, why are we doing this? Beyond the convenience of explaining the field to those outside it, would precision of definition be a goal? Or efficiency? This could help practitioners in the “definition experiment” understand what a better outcome could be, or even a better failure.

If precision is less important, but creating understanding within the field is more so, Digital Humanities may best be defined by a set of values, as Spiro begins to do. Values are difficult to wrangle as well, but after examining more of the texts this week I believe they have a point: The DH field and its practitioners are most likely to have these characteristics in common. The values suggested (Openness, Collaboration, Collegiality & Connectedness, Diversity, Experimentation) are broad but difficult to argue with especially given the work we have been presented with this week and their extended definitions. I believe many of us have come to study DH because we hold these values in our work as well and are excited to find a field that may support them.