As I mentioned on Wednesday, I went into this project thinking I had a hypothesis in mind and was determined to make a discovery. But I ended up spending most of this project just exploring the functionality of both Voyant and Google Ngram, and wasn’t able to really make any monumental revelations. I was even wracking my brain to come up with sample text that would reveal something, but struggled to think up anything specific. I ended up browsing the public domain and pulled up Louisa May Alcott’s, Little Women, just to get started with something. But exploring is good – and I enjoyed getting familiar with these text analysis tools.
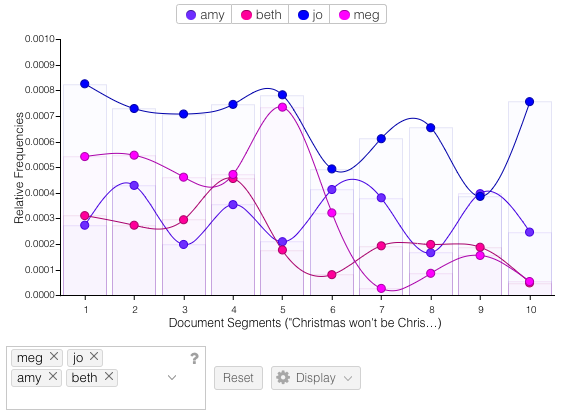
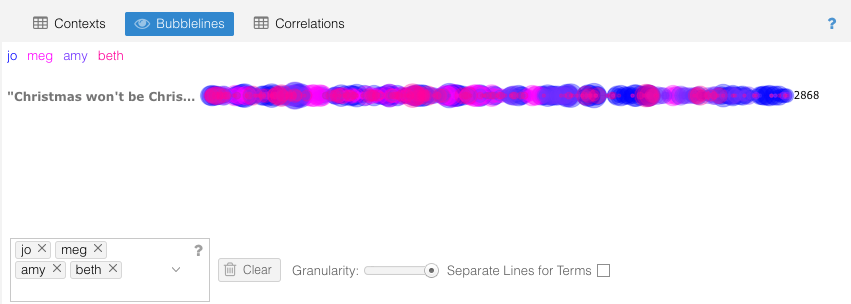
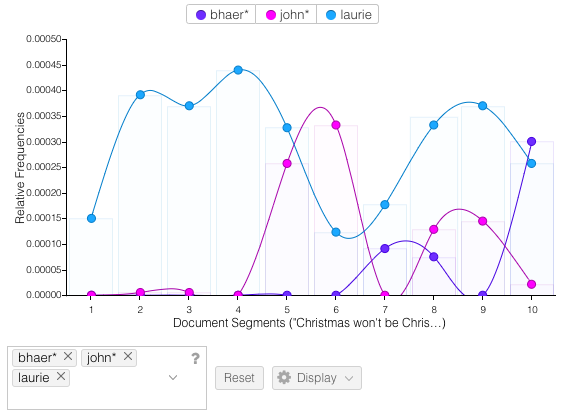
Voyant is easy to use and gives lots of tools to click through and try out. It’s also very visually appealing. I pasted in the text of the full novel and first searched within the Trends and Bubblelines windows to see how often each of the sisters are mentioned throughout the course of the novel. The results are clear to follow and not too surprising (see the number of mentions of Beth and Meg decline after their death and marriage respectively – sorry, spoilers). I did find that 2 of the colors were a little too close in shade, and I didn’t figure out how to change them to see a little more color contrast. Next I wanted to see the equivalent searches for the major male characters of the novel. Laurie was already one of the most common terms, so he popped up in the top 10 drop down to select. But I had to stop and think about how to search for Friedrich Bhaer and John Brooke. I looked up both first and last names to find the most frequent name for each character, and ended up going with “Bhaer” and “John”. Again, clean narratives lines are the end result. I did like being able to reference the content in the Reader window by clicking on one of the points in the Trends chart and seeing it take you right to the start of that content segment. I also found it helpful to hover over an individual word in Reader to see its frequency, and then click to have that term override the Terms window to see that same frequency trend line over the duration of the novel.
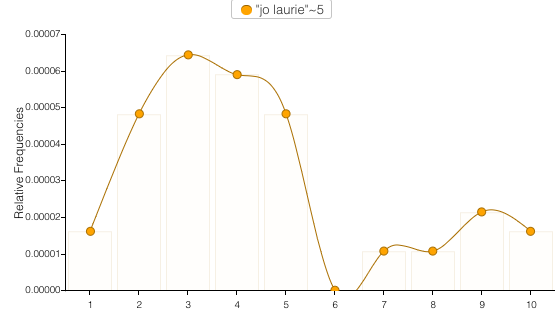
Finally I explored the Links feature to see common relationships between words in the text. For obvious reasons I chose to look at the link between Jo and Laurie. It’s really entertaining to watch the word bubbles hover around between the connecting lines. Trends seems to be the default reactor for most of the clicks as immediately clicking on the links line creates a new Trends line there. I accidentally discovered this and had to re-do the previous search to go back.

Voyant really does all the heavy lifting for you, and there’s zero insight into how it operates behind the scenes. For quick, easy to visualize results, Voyant does a great job. While looking specifically at a novel, Voyant was useful for tracing narrative connections. I could see it being some kind of add on to Sparknotes for readers looking to dig deeper into content. But overall I think I was a little disappointed with the tool’s limitations.
Next I plugged “Little Women” into Google’s Ngram to see frequency trends of the novel title over time. Similar to my work in Voyant, I wasn’t too surprised with the results but had fun using the tool.
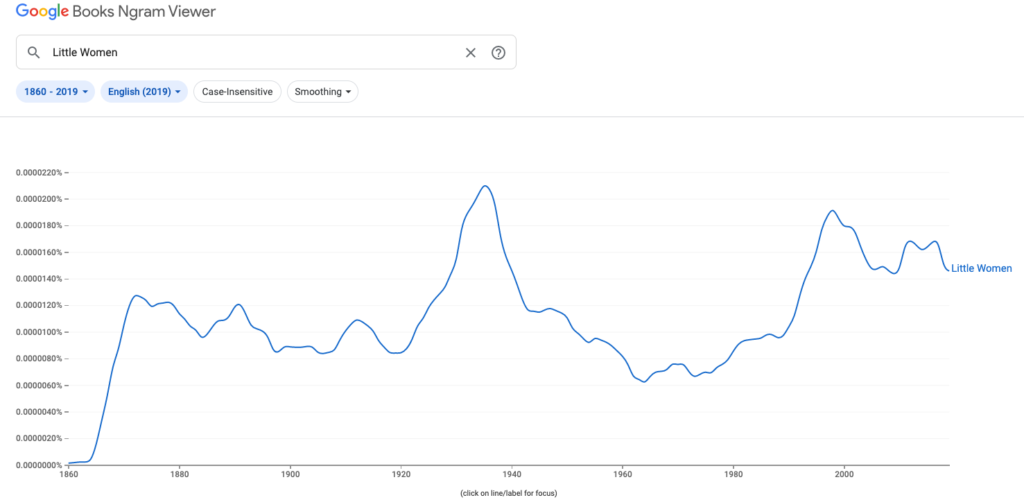
The frequency count begins to increase after 1864, continuing up steadily through the novel’s publication in 1868 and peaking at 1872. Then it plateaus and fluctuates through 1920 before dramatically increasing again with the highest peak at 1935. A quick search told me that the story’s first sound film adaptation starring Katharine Hepburn premiered in 1933. For me the best part of using Ngram was playing detective and digging up the reasons behind the frequency increases. A couple other highlights I clued into: the 1994 Academy Award-nominated film adaptation and a major mention in a popular episode of ‘Friends’ in 1997.
Overall I did find the text analysis praxis valuable because I was able to experiment and explore what the tools are capable of. Probably the most important lesson I learned is that projects don’t always turn out the way you expect them to. In a way this is similar to the mapping praxis but instead of the scope limiting me, it was the tools here that put up those constraints. I also think I got in my own way by having really high expectations going into things, thinking I would have a strong hypothesis up front and the tools would help me prove it. We discussed that this area of DH can be challenging despite most initially assuming text mining to be immediately beneficial for projects in the field. And after this praxis, my assumptions have definitely changed.


You make Voyant sound and look easy to use it your review, Amanda. I appreciated the fact that you didn’t have such a strong hypothesis going in but still identified the main features of Voyant quite easily and found enjoyment in using Ngram which lead to the discovery of why the book was mentioned throughout history. It’s a shame the graphics and features aren’t a bit fancier with Voyant, but I am still impressed by how easily you did this. I really think this tool should be introduced to students much earlier in their education rather that waiting til college!