Author Archives: David K Ahamad

Text Mining through HathiTrust

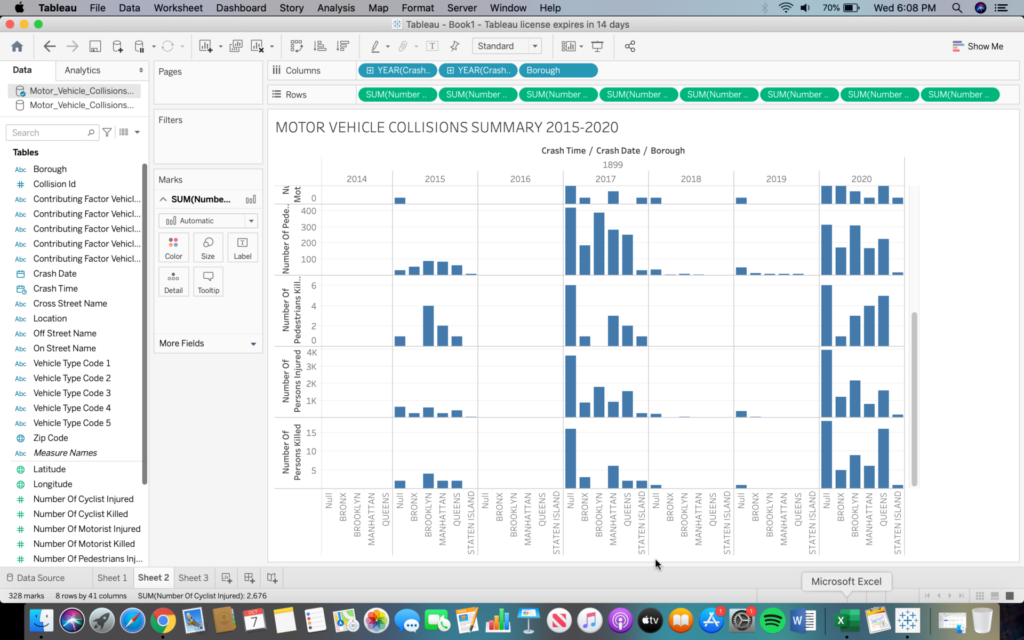
Having just taken part in the HathiTrust digital library workshop I chose to use HathiTrust and their analytical engine to do this text mining assignment. The first step was to find a collection of texts to analyze. Thankfully, HathiTrust has a tab specifically tailored to finding either ready made collections or forming new ones. I chose to use a collection of texts which used the word “detective” in published works prior to 1950. There were only 61 volumes in this particular collection, so it was a good place to start my experiment. It is worth mentioning that should you need to, HathiTrust allows you to make your own collections based on terms you search up. Using this collection I downloaded a TSV file which held all of the volumes in tabs according to the frequency of the word “detective”. HathiTrust’s analytics was located on a different site, where you can upload your TSV file and run algorithms to visualize a topic model of the term used, themes and frequency. Using the InPho Topic Model Explorer I was able to create an interactive topic bubble model. Attached is the link and screenshot of what the map looks like.

https://analytics.hathitrust.org/result/dahamad/0e06f601-eb0c-4a07-8bd9-f2765a3a4b55/job_results/topics.html

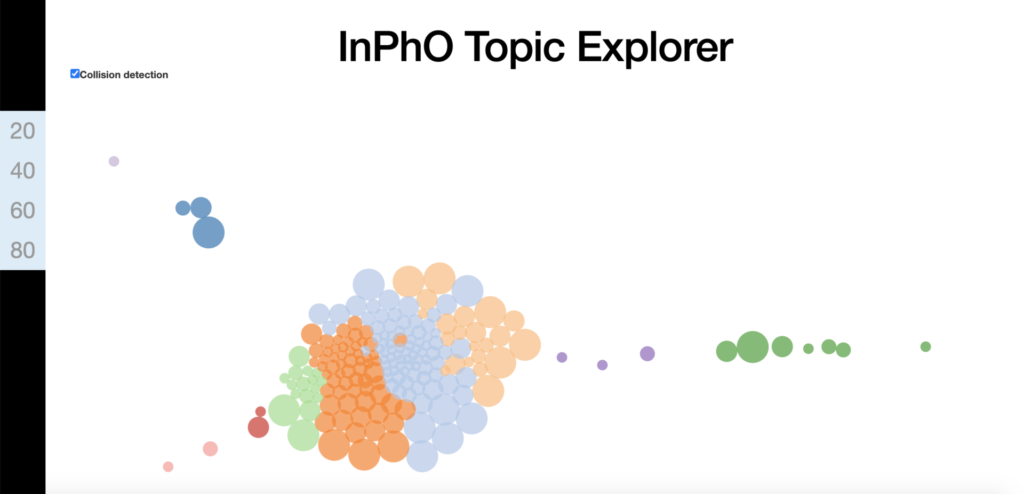
The algorithm groups clusters and color codes them automatically according to groups of topics and similar themes. If you follow the link you will see, for example, that the orange clusters are characterized by fictional stories, and mysteries in which the word “detective” is frequently used. If you use your mouse to hover over each bubble you will see these commonalities mentioned quite often. Also, it is easier to discern similar themes and topics if collision detection is turned off. The above image of the topic model is of the model with collision detection turned on. Below is an image of the topic model with collision detection turned off.

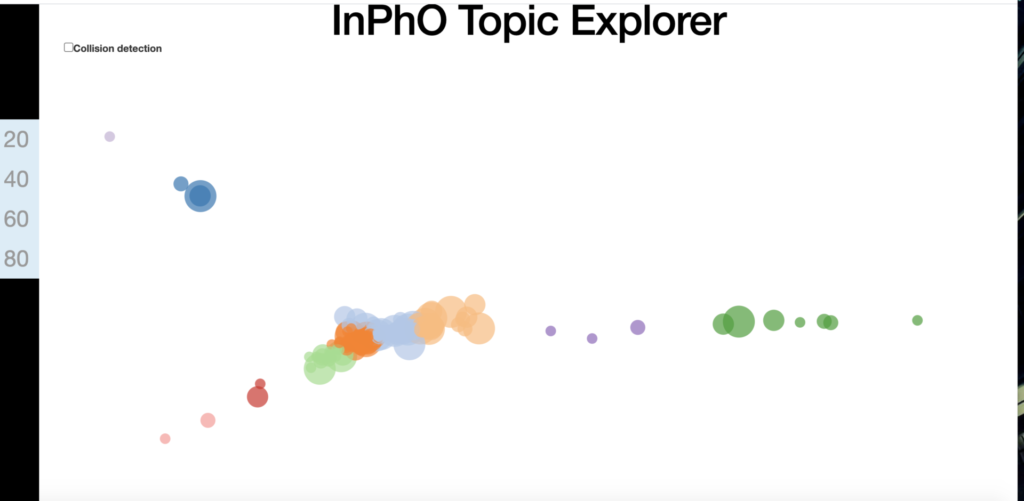
Hovering over the cluster with collision detection turned off makes it easier to see what themes the color coded clusters share.

Being curious about the trends of the terms “detective” and “crime” I then utilized HathiTrust’s Bookworm application to further this experiment. The Bookworm search does not use a specific collection, rather it searches HathiTrust’s entire digital library to display a simple double line graph of the usage of terms over time. The end result is a clear visualization of the the trends in term usage over a period of 250 years.

From this graph the most significant take away is the correlation of the uptake in usage of the terms “detective” and “crime” with the rising popularity of detective novels and media from the 1920’s on. Prior to 1920, as is confirmed by the InPho Topic Model, the term “detective” was used in mostly a non-fictional or informational capacity.

A downside to both Bookworm and the InPho Topic Model Explorer is that the texts themselves are not listed. To access the texts used one would either have to record every volume in a collection or look closer into the TSV file itself, as far as I know. Since I attended the workshop finding my way around HathiTrust was not too difficult, however, they are limited by the scope of information available through their digital library. Although partnered with several institutions, including the Grad Center, you may not have much luck mining more obscure terminology. Some terms include those with ethnic connotations or terms not consistent with Western academia, like terms with regional specificity.

Working with HathiTrust Data Workshop

This past Thursday, October 22nd, 2020, I had the opportunity to attend the Working with HathiTrust Data workshop offered by Param Ajmera. HathiTrust Data is most similar to an online historical archive/library on the surface level. This workshop delves deeper into the applications of the HathiTrust digital library as a tool for text analysis and visualization. Having some familiarity on the different uses of historical archives and how they retrieve text through the utilization of key word searches, which the first portion of the workshop demonstrated how to do, I was unsure exactly of what set HathiTrust data apart from traditional historical archives.

Made available through the use of cloud computing infrastructure HathiTrust, like most digital archives, is able to retrieve text in bulk and then analyze said text with the sole purpose of creating visualizations based on topic modeling. Topic modeling, as explained in the workshop, is procedurally described as first creating a workset through input terms and chunking the texts retrieved into documents which are then used to create a visualization based on word usage. It is worth mentioning that HathiTrust uses programs called API’s (Application Programming Interface) used to retrieve and sort texts using your input terms, which are then organized and visualized by a program called Bookworm. A clear example used to demonstrate its use during the workshop was comparing ideological information present in three different President’s speeches. Using the input terms “nationalism” and “internationalism” we were able to see, through the information visualized on a line graph, the ideological prevalence of nationalism and internationalism over the course of 240 years (1760-2000) and the presidencies within that time period, with most of the discernible data being present in the final 120 years (1880-2000). The final part of the workshop provided some scope into the amount of information available on HathiTrust. Although, not partnered with different libraries, millions of titles are still available through partnership with many different academic and research institutions.

I believe that most of the HathiTrust’s utility derives from its streamlined process of predictive word usage and ease of use where Bookworm is coupled with text analysis. This process was described in a non-convoluted, easy to understand way that not only reaffirms the importance of historical review, but also how easily it blends with digital visualization. There is trove of information available through topic modeling and it presents itself as invaluable to the study of history. I believe, however, that this information is only accessible to the wider academic audience through clear, presentable visualization techniques, as texts to be gathered and hits on the usage of certain words can sometimes total in the trillions. HathiTrust’s use of API and Bookworm are two solutions to this problem that I am excited to see adapt with technology.

PRAXIS Mapping Assignment-Mapping those either injured or killed by motor vehicle collisions by borough

For the first mapping assignment I opted to learn how to use Tableau’s mapping feature. Since I am using the fourteen-day free trial some features were not available to me, so I will be posting screenshots of the map as well as the corresponding numbers per borough as the trial version does not allow me to publish a navigable link.

Since this was my first encounter with any mapping software some initial difficulties i faced were becoming accustomed to the user interface and how things were meant to work. Once I understood how to properly utilize Excel spreadsheets through Tableau and the different uses of CSV Excel spreadsheets and regular spreadsheets the process to map the data became clear. Through Tableau you are only able to map up to two geographical variables, so although the data I procured through the NYC Open Data Project’s website provided several different data, such as number of cyclists, motorists, pedestrians, etc. injured or killed, I chose only to map the most serious part of the data which was the total number of peoples killed or injured in motor vehicle accidents.

https://data.cityofnewyork.us/Public-Safety/Motor-Vehicle-Collisions-Crashes/h9gi-nx95

Above is the link to data and exportable Excel spreadsheets of data on motor vehicle accidents from 2015-2020. Attached below are the screenshots of the data I organized through Tableau and the final map. The file of the spreadsheets is too large to be posted here but can be easily accessed through the above link.

Above is the final map produced from the CSV Excel spreadsheet. The numbers represented by these orange dots are as follows:

BRONX: 30,292 INJURED, 89 KILLED

MANHATTAN: 27,194 INJURED, 129 KILLED

BROOKLYN: 62,936 INJURED, 238 KILLED

QUEENS: 51,090 INJURED, 223 KILLED

STATEN ISLAND: 7,037 INJURED, 36 KILLED (This data is negligible compared to the other boroughs and as such the dot over Staten Island is barely visible, despite the orange color.)

Although rudimentary, this first attempt at mapping anything has provided many valuable insights. These initial difficulties that I have been able to overcome will now allow me to move into mapping more sophisticated and personal data. I am interested now in mapping multiple variables with geospatial connotations as maps of this nature are usually the easiest to comprehend and the limit to what can be mapped geographically is nearly endless. I am unsure, however, of what software program to attempt next, as Tableau was straight forward and beginner friendly, but limiting in terms of mapping options.

Defining DH

One thing this week’s reading make abundantly clear is the multifaceted , and sometimes fluid definition of DH that is so often employed by scholars. My own limited understanding of the digital humanities has led me to evaluate these definitions in a contemporary sense in order to understand the essential value the digital humanities has in academia. Paraphrasing from Matthew K. Gold’s “The Digital Humanities Moment” the DH is currently one of the only fields of research which possesses the ability to address the ever changing nature of academics in order to accommodate our advanced technological realities. Although a preliminary definition, this tentative understanding of the worth and function of the digital humanities led to my better understanding that like most fields of study the digital humanities are subject to change, perhaps more so than several others. Although the field of DH lends itself to easy interpretation, defining those who practice in the digital humanities proves to be a more meticulous task. In Lisa Spiro’ s “This is Why We Fight: Defining the Values of Digital Humanities” a specific acknowledgement is included offering some perspective on this issue. Stating the lack of core values amongst a community consisting of those with “different disciplines, methodological approaches, professional roles and theoretical implications”, Spiro demonstrates how this varied group inversely affects forming a tight definition of DH.

Spiro’s assessment of the field of DH and those who practice in it raises the question about what exactly would serve as core values. In a field which lacks a uniform body of scholars all from the same disciplines defining core values necessitates an abstract description. Spiro states “In defining core values, the community needs to consider what it is excluding as well as the cultural and ideological contexts surrounding the values it promotes. Given the diversity of the community and the ways in which culture informs values…”. Decidedly vague and justifiably so, Spiro’s mode of assessment allows for two things: the first being the expansion of DH to be an interdisciplinary field of study, and the second provides a criteria by which practitioners of the digital humanities can define their work. So what does this mean? To link this definition to the wider view of DH, therefore encompassing the varied individuals who inhabit the field, an understanding is provided by Lauren F. Klein and Matthew K. Gold in “Digital Humanities: The Expanded Field”. Klein and Gold’s understanding of the digital humanities goes hand in hand with Spiro’s assessment in explicitly acknowledging a “…decentering of digital humanities, one that acknowledges how its methods and practices both influence and are influenced by other fields.” Where Spiro finds the digital humanities to be a diverse community in need of interdisciplinary focus, and intersectional contexts, Klein and Gold confirm this notion by stating this abstract, but accurate description, “…enrich its discourse and extends it reach.”

Forming a fully functional definition of the digital humanities is no easy task. One might even say that it would be impossible to define a field whose influence is the very basis for the future of academia. Departing momentarily from vague “big tent” descriptions and a polymorphic idea of the digital humanities as it changes according to technology, we have one significantly explicit tell in field work. The work produced by those in the field provides for us a working definition that serves the alternate purpose of defining the fields influenced by and included in DH. The project titled “The Early Caribbean Digital Archive” demonstrates the how the intersections of sociology, history and DH are used to create a platform to best deliver and interpret data. This method of data representation offers itself to extrapolation while simultaneously confirming the interdisciplinary nature of DH.

The information I have gleaned from these readings can effectively be summed up by acknowledging DH as a field that is still in its early stages. It exists as a recent addition to Masters programs at the Graduate Center and has only recently found its footing in academia. If these early definitions of DH are any indication of its ubiquitous nature in our technological realities, however, then the future of DH is well secured. It has also proven itself to be a viable career path as tentative descriptions have painted DH as essentially invaluable to all facets of academia.